

Question: - Refer to Table S6.1 - Factors for Computing Control Chart Limits (3 sigma) for this problem, Twelve samples, each containing five parts, were taken
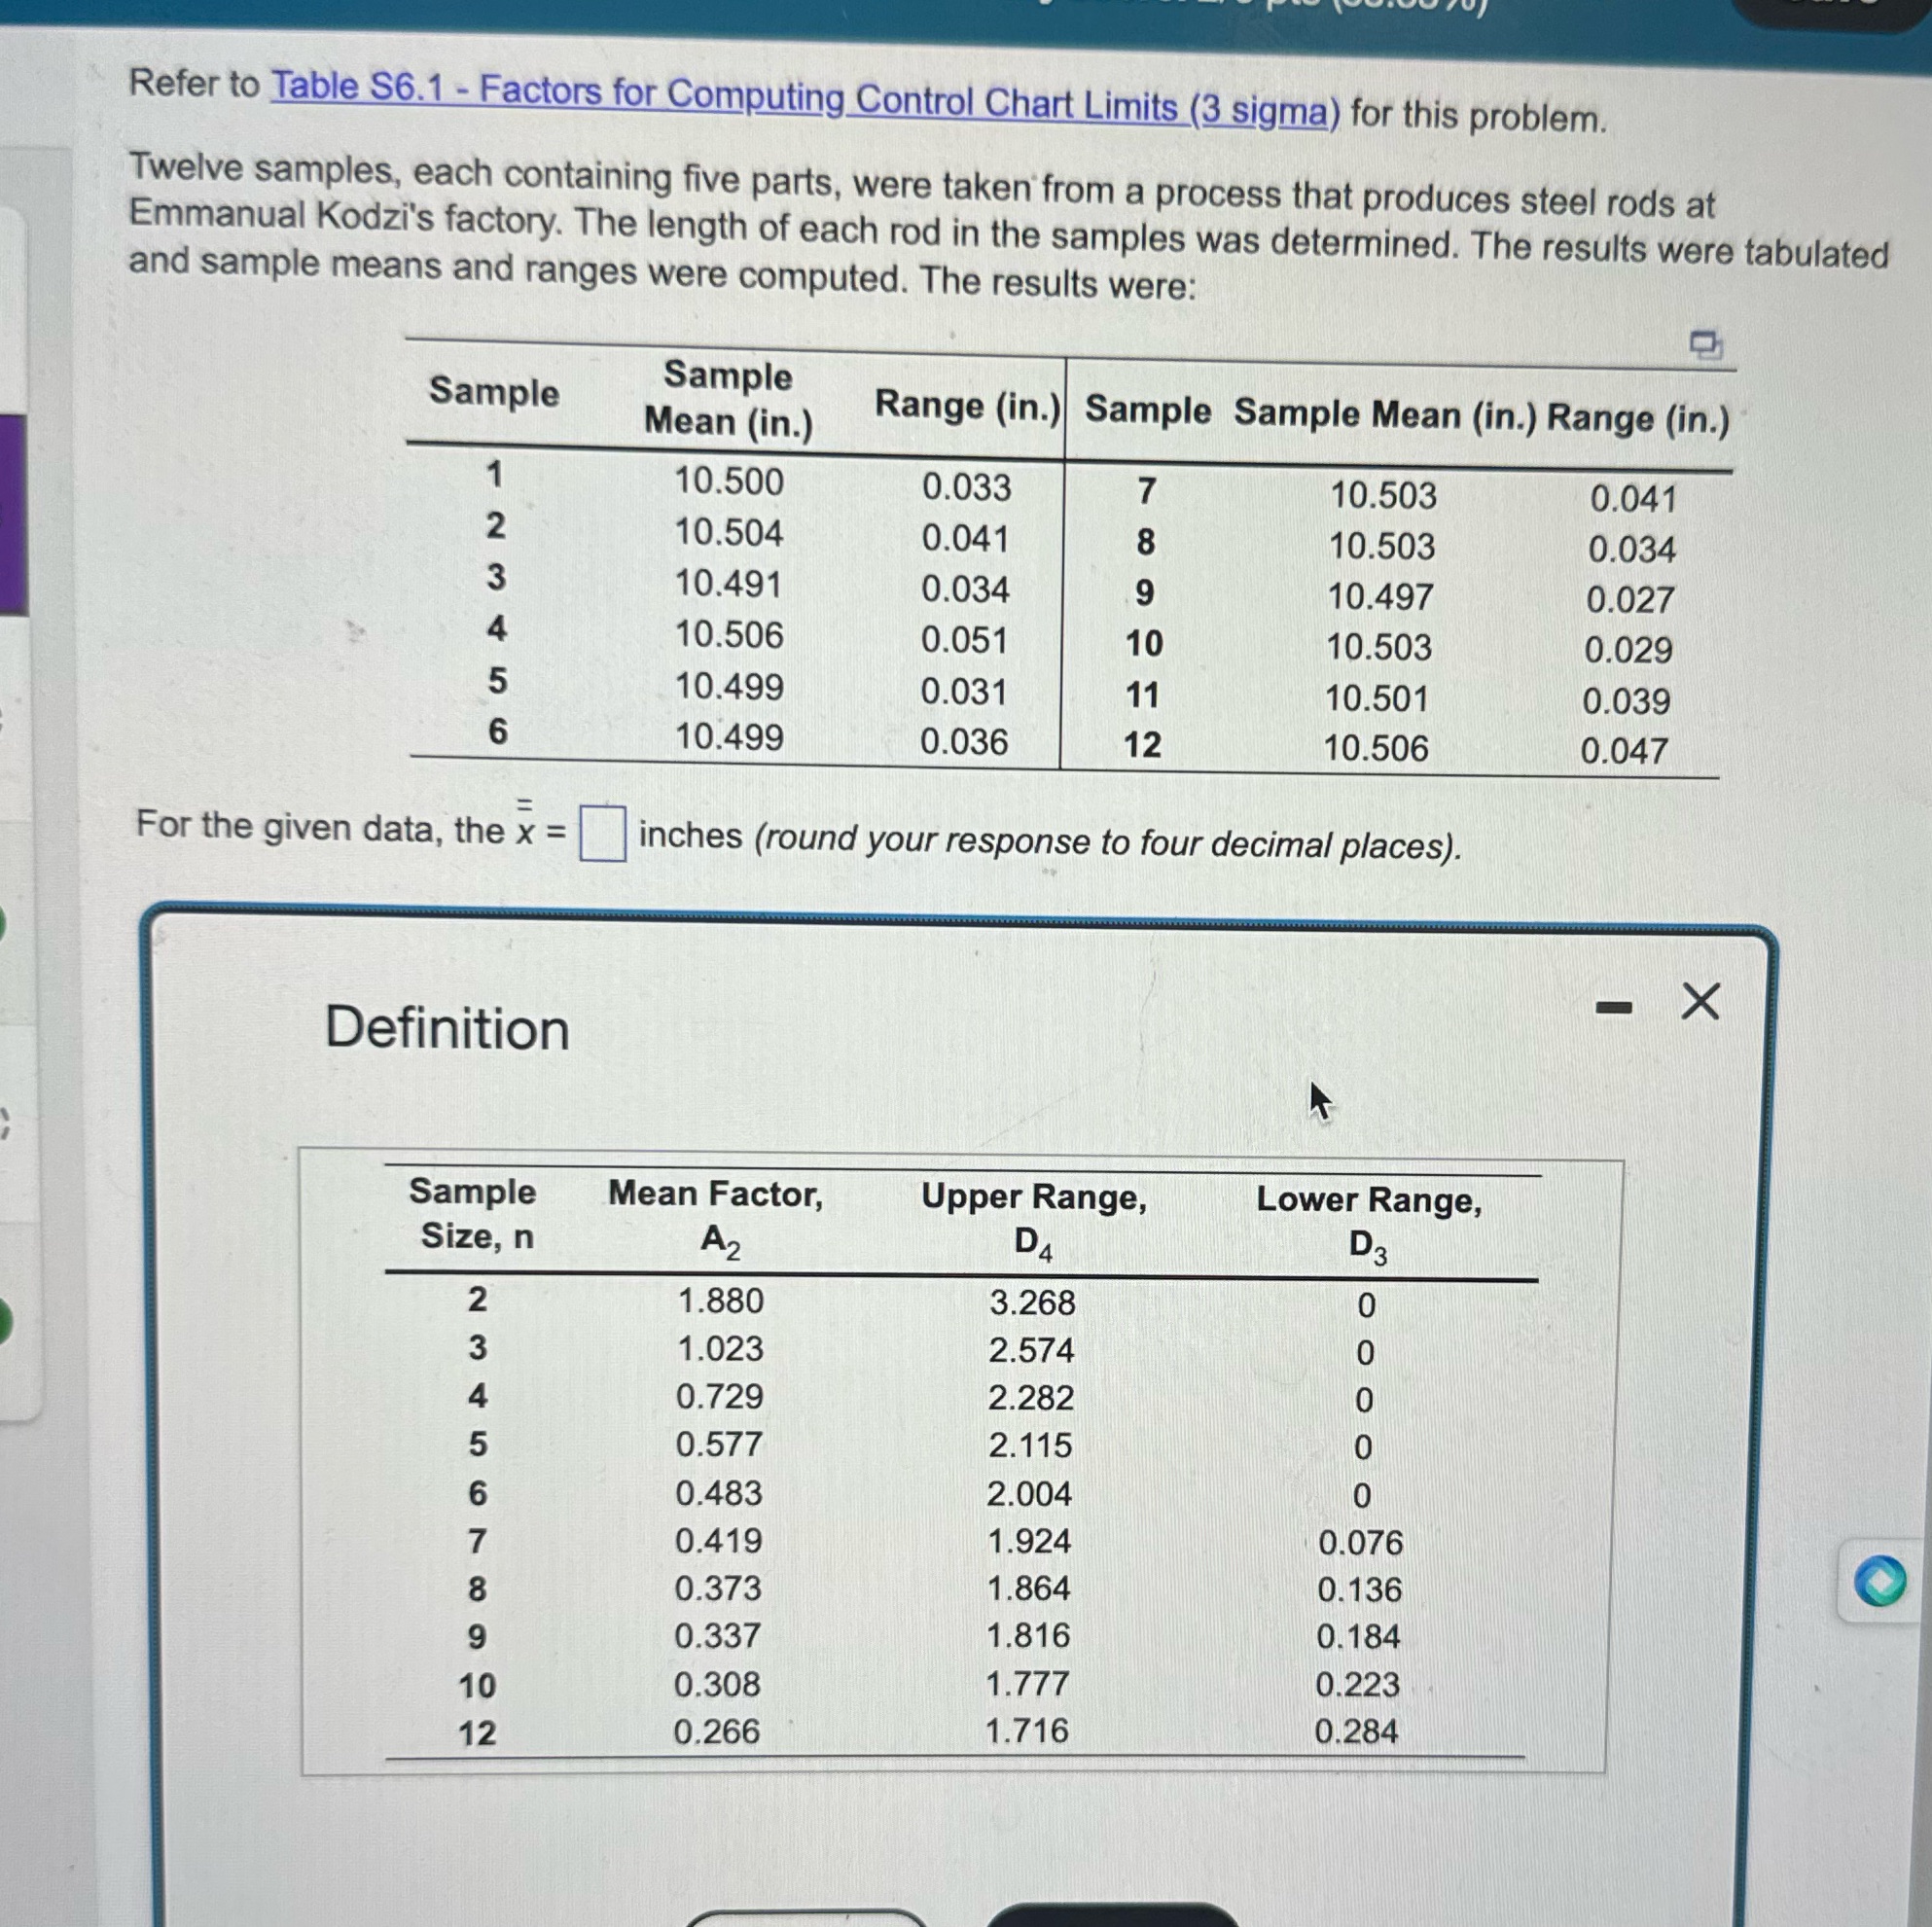
- Refer to Table S6.1 - Factors for Computing Control Chart Limits (3 sigma) for this problem, Twelve samples, each containing five parts, were taken from a process that produces steel rods at Emmanual Kodzi's factory. The length of each rod in the samples was determined. The results were tabulated and sample means and ranges were computed. The results were: & Sample MS;Z':':::_) Range (in.)) Sample Sample Mean (in.) Range (in.) For the given data, the x = D inches (round your response to four decimal places). Definition X Sample Mean Factor, Upper Range, Lower Range, Size, n A, D, D, 2 1.880 3.268 0 3 1.023 2.574 0 4 ).729 2.282 0 5 0.577 2115 0 6 0.483 2.004 0 7 0.419 1.924 0.076 | Q 8 0.373 1.864 0.136 : 9 0.337 1.816 0.184 10 0.308 1777 0.223 12 1.716 0.284 0.266 {
Step by Step Solution
There are 3 Steps involved in it

Get step-by-step solutions from verified subject matter experts