

Question: Refer to Table S6.1 - Factors for Computing Control Chart Limits (3 sigma) for this problem. Sampling 4 pieces of precision-cut wire (to be used
Refer to Table S6.1 - Factors for Computing Control Chart Limits (3 sigma) for this problem.
Sampling 4 pieces of precision-cut wire (to be used in computer assembly)every hour for the past 24 hours has produced the following results:
Hour Xbar R Hour Xbar R Hour Xbar R Hour Xbar R 1 3.15 0.65 7 3.15 0.53 13 3.11 0.90 19 3.41 1.56 2 3.00 1.18 8 2.65 1.18 14 2.93 1.36 20 2.99 1.04 3 3.22 1.38 9 3.12 0.71 15 3.22 1.01 21 2.65 1.08 4 3.49 1.31 10 2.95 1.38 16 2.84 0.50 22 3.18 0.41 5 2.97 1.17 11 2.83 1.22 17 2.96 1.38 23 2.94 1.58 6 2.86 0.42 12 3.07 0.35 18 2.74 1.29 24 2.74 0.97
Question content area
Part 1
Refer to
Table S6.1 - Factors for Computing Control Chart Limits (3 sigma)
LOADING...
for this problem.
Sampling
4
pieces of precision-cut wire (to be used in computer assembly) every hour for the past 24 hours has produced the following results:
| Hour | x | R | Hour | x | R | Hour | x | R | Hour | x | R |
| 1 | 3.15" | 0.65" | 7 | 3.15" | 0.53" | 13 | 3.11" | 0.90" | 19 | 3.41" | 1.56" |
| 2 | 3.00 | 1.18 | 8 | 2.65 | 1.18 | 14 | 2.93 | 1.36 | 20 | 2.99 | 1.04 |
| 3 | 3.22 | 1.38 | 9 | 3.12 | 0.71 | 15 | 3.22 | 1.01 | 21 | 2.65 | 1.08 |
| 4 | 3.49 | 1.31 | 10 | 2.95 | 1.38 | 16 | 2.84 | 0.50 | 22 | 3.18 | 0.41 |
| 5 | 2.97 | 1.17 | 11 | 2.83 | 1.22 | 17 | 2.96 | 1.38 | 23 | 2.94 | 1.58 |
| 6 | 2.86 | 0.42 | 12 | 3.07 | 0.35 | 18 | 2.74 | 1.29 | 24 | 2.74 | 0.97 |
Based on the sampling done, the control limits for 3-sigma x chart are (round all intermediate calculations to three decimal places before proceeding with further calculations):
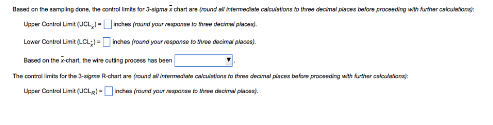
Based on the x-chart ne wive catsug procees has baen
Step by Step Solution
There are 3 Steps involved in it

Get step-by-step solutions from verified subject matter experts