

Question: Refer to Table S6.1 - Factors for Computing Control Chart Limits (3 sigma) for this problem. Sampling 4 pieces of precision-cut wire (to be used
Refer to Table S6.1 - Factors for Computing Control Chart Limits (3 sigma) for this problem. Sampling 4 pieces of precision-cut wire (to be used in computer assembly) every hour for the past 24 hours has produced the following results: Hour 1 2 3 4 5 6 X 3.35" 3.10 3.12 3.39 2.97 2.76 R 0.71" 1.13 1.43 1.21 .22 0.37 Hour R X R Hour X 3.05" 0.53" 7 Hour 13 3.01" 0.80" 14 2.93 1.26 20 19 8 2.75 1.18 9 3.02 0.71 15 21 3.02 1.01 16 2.74 0.45 10 2.95 1.28 22 1.12 11 2.73 17 2.76 1.43 23 12 2.97 0.35 18 2.74 1.29 24 X 4.51" 2.99 2.55 3.28 2.94 2.54 R 1.66" 1.14 1.08 0.41 1.63 0.92 Based on the sampling done, the control limits for 3-sigma x chart are (round all intermediate calculations to three decimal places before proceeding with further calculations): Upper Control Limit (UCL.) = inches (round your response to three decimal places).
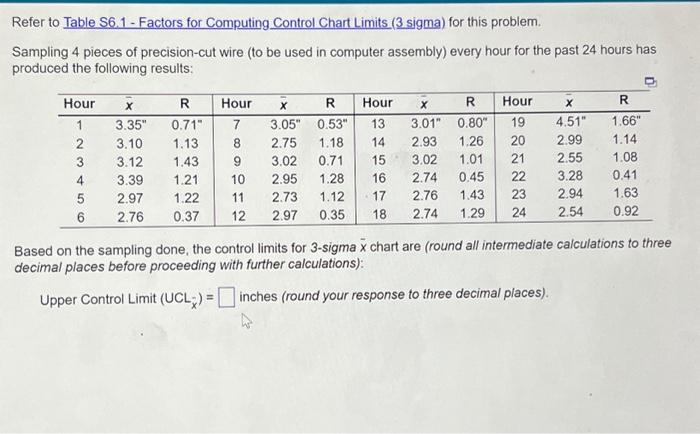
Refer to Table S6.1 - Factors for Computing Control Chart Limits (3 sigma) for this problem. Sampling 4 pieces of precision-cut wire (to be used in computer assembly) every hour for the past 24 hours has produced the following results: Based on the sampling done, the control limits for 3 -sigma x chart are (round all intermediate calculations to three decimal places before proceeding with further calculations): Upper Control Limit (UCLx)= inches (round your response to three decimal places)
Step by Step Solution
There are 3 Steps involved in it
1 Expert Approved Answer
Step: 1 Unlock

Question Has Been Solved by an Expert!
Get step-by-step solutions from verified subject matter experts
Step: 2 Unlock
Step: 3 Unlock