

Question: Refer to Table S6.1 - Factors for Computing Control Chart Limits ( 3 sigma) for this problem. Thirty-five samples of size 7 each were taken
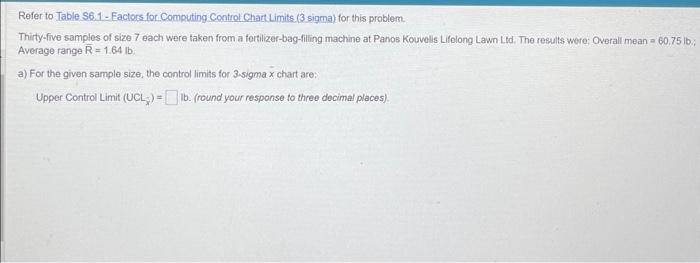
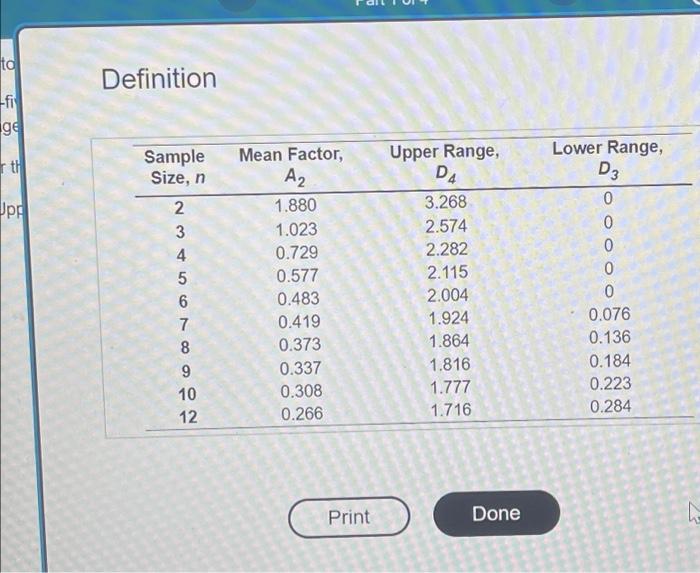
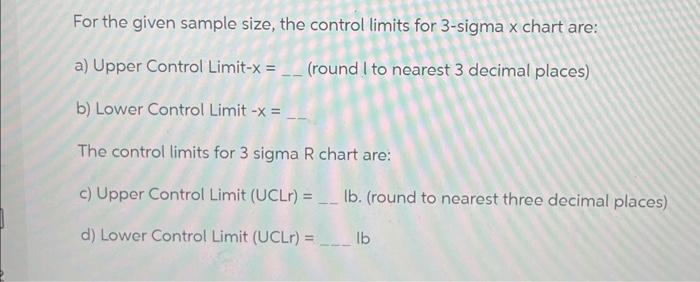
Refer to Table S6.1 - Factors for Computing Control Chart Limits ( 3 sigma) for this problem. Thirty-five samples of size 7 each were taken from a fertilizer-bag-filing machine at Panos Kouvells Lifelong Lawn Ltd. The results were: Overall mean a 60.75 ib; Average range R=1.64lb. a) For the given sample size, the control limits for 3 -sigma chart are: Upper Control Limit (UCLx)= 16. (round your response to three decimal places). Definition For the given sample size, the control limits for 3 -sigma x chart are: a) Upper Control Limit-x = (round I to nearest 3 decimal places) b) Lower Control Limit x= The control limits for 3 sigma R chart are: c) Upper Control Limit (UCLr) = lb. (round to nearest three decimal places) d) Lower Control Limit (UCLr) = lb
Step by Step Solution
There are 3 Steps involved in it

Get step-by-step solutions from verified subject matter experts