

Question: Refer to Table S6.1 - Factors for Computing Control Chart Limits (3 sigma) for this problem. A process that is considered to be in control
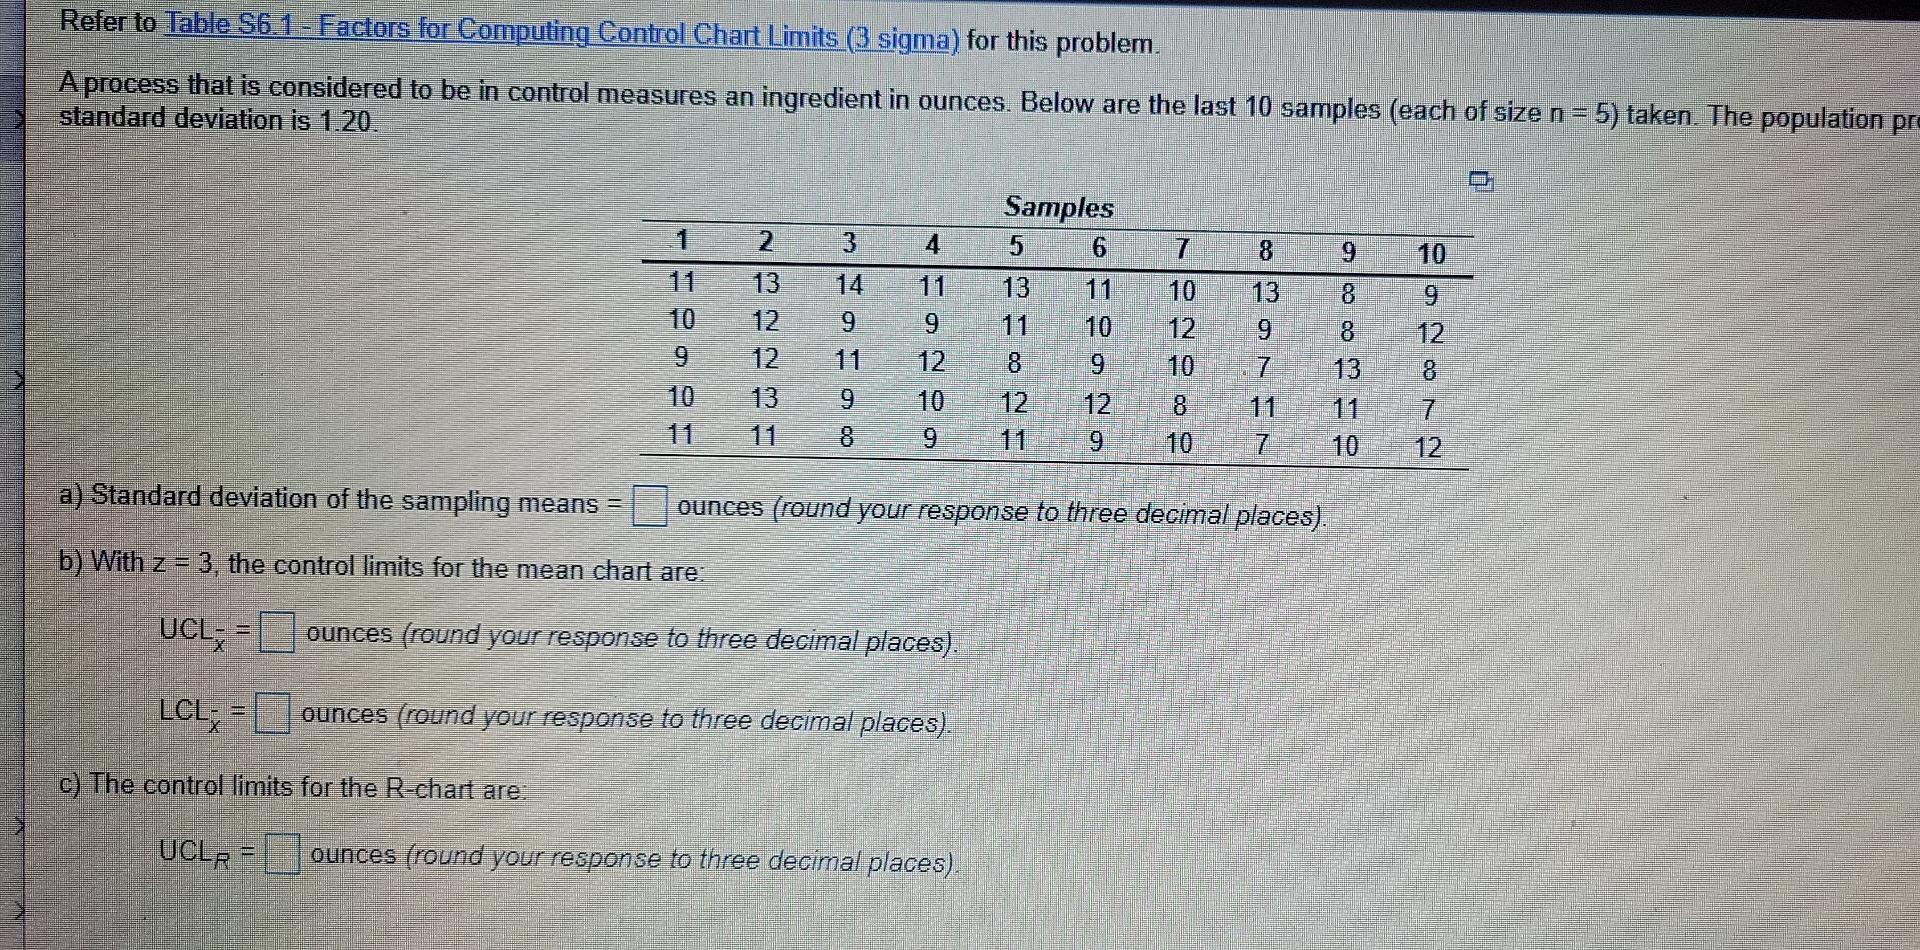
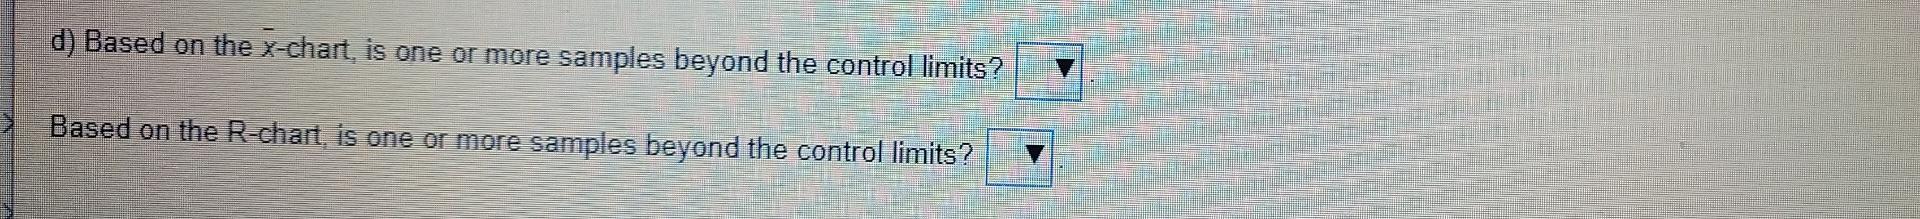
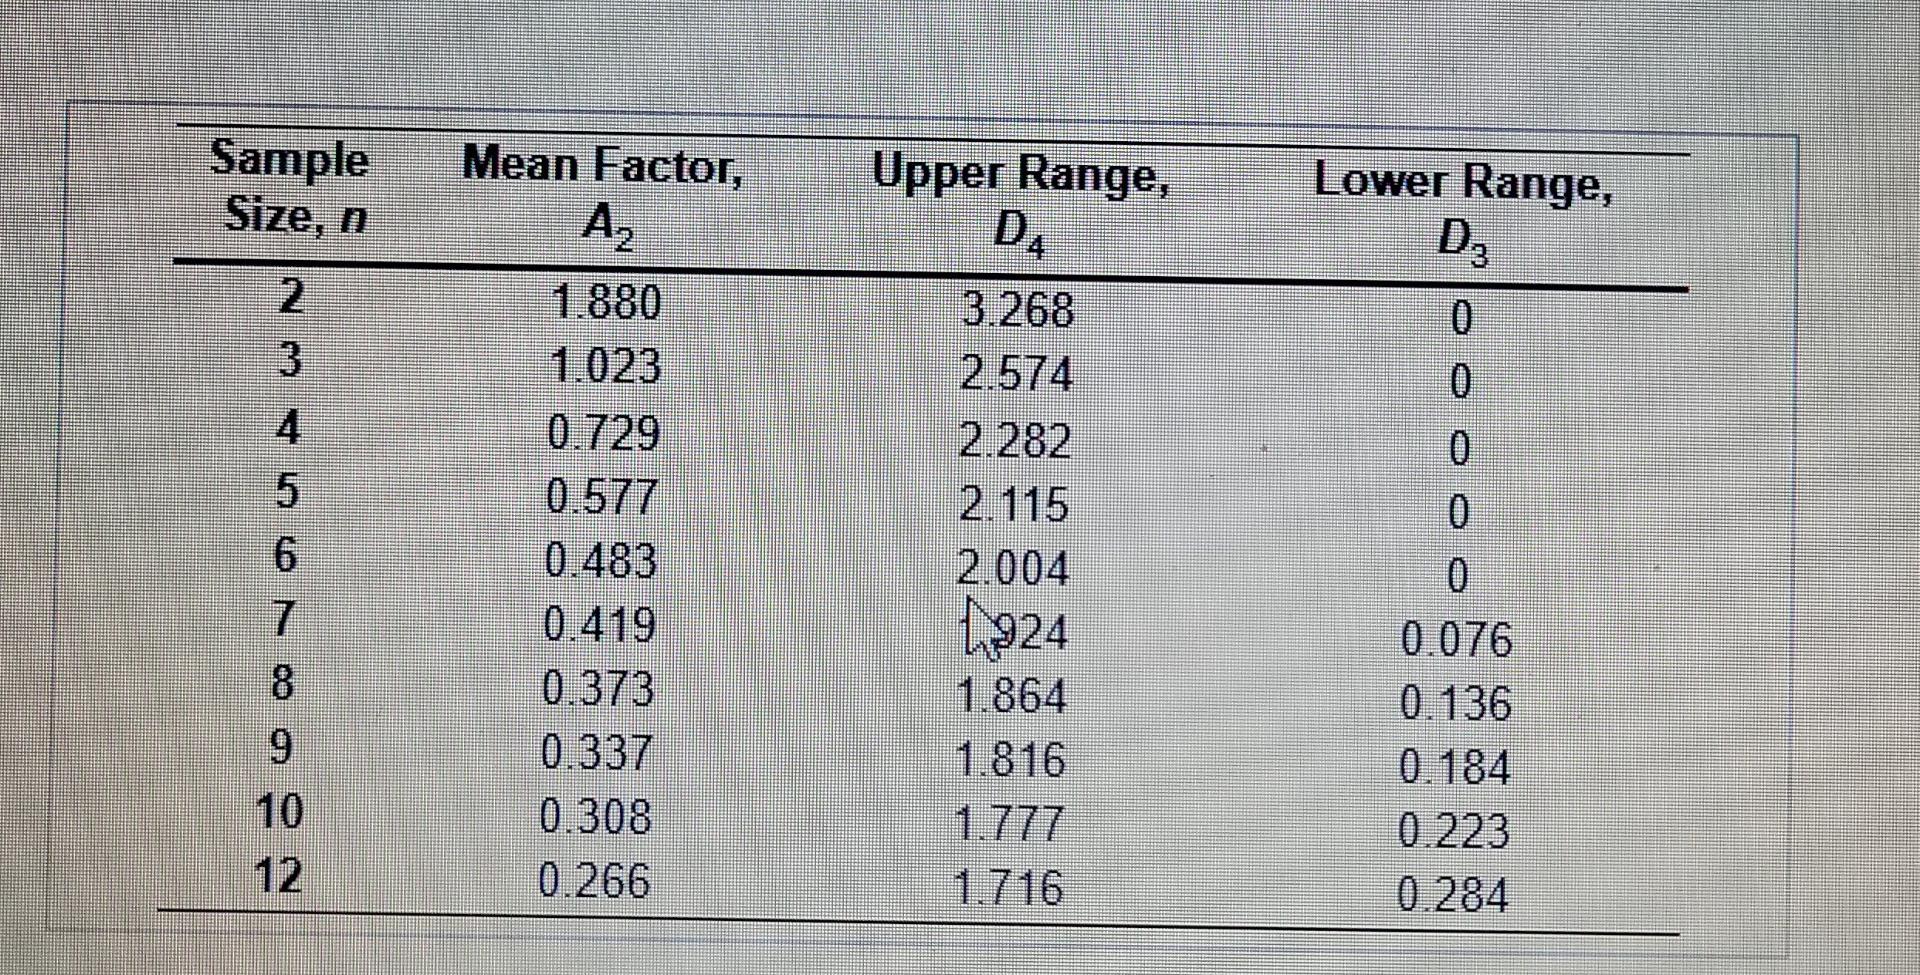
Refer to Table S6.1 - Factors for Computing Control Chart Limits (3 sigma) for this problem. A process that is considered to be in control measures an ingredient in ounces. Below are the last 10 samples (each of size n = 5) taken. The population pre standard deviation is 1.20. Samples 5 6 4 7 8 10 13 9 13 12 12 13 9 9 9 10 12 10 10 8 8 13 8 9 10 7 8 13 9 12 10 9 12 8 12 9 11 8 7 12 7 10 a) Standard deviation of the sampling means = ounces (round your response to three decimal places). b) With z = 3, the control limits for the mean chart are: UCL = ounces (round your response to three decimal places). LCL = ounces (round your response to three decimal places). c) The control limits for the R-chart are: UCLR = ounces (round your response to three decimal places). d) Based on the x-chart, is one or more samples beyond the control limits? Based on the R-chart, is one or more samples beyond the control limits? Sample Size, n Mean Factor, A2 Upper Range, Lower Range, D4 3 0 gooc vao AwN 1.880 1.023 0.729 0.577 0.483 0.419 0.373 0.337 0.308 0.266 3.268 2.574 2.282 2.115 2.004 1924 1.864 1.816 1.777 1.716 0 0 0 0.076 0.136 0.184 0.223 0.284
Step by Step Solution
There are 3 Steps involved in it
1 Expert Approved Answer
Step: 1 Unlock

Question Has Been Solved by an Expert!
Get step-by-step solutions from verified subject matter experts
Step: 2 Unlock
Step: 3 Unlock