

Question: Refer to Table S6/1 Factors for Computing Control Chart Limits (3 sigma) for this problem. Krzy A process that is considered to be in control
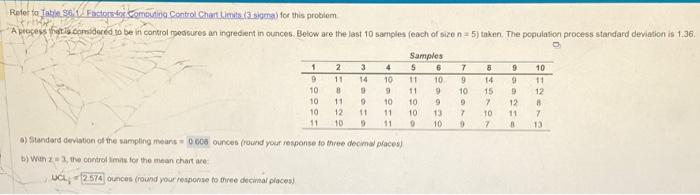
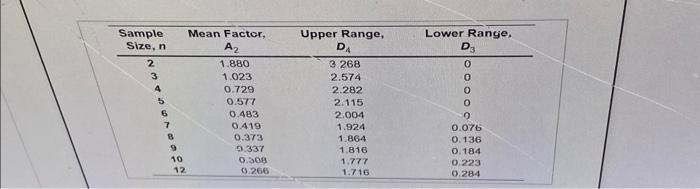
Fefer ta Jable Sg, 1- Factorsfox Cemputing Control Chart Limits (3 sigma) for this problem. A prosess thet samidered to be in control medsures an ingredient in ounces. Bolow are the last 10 samples feach of size n=5 ) taken. The populasion process standard deviation is 1.36 . () Slandsid deviation of the sampling means = ounces (round your response to three decima places) b) Wer 2=3, the controt imas for the mean chart are UCy = [2.574] ounces (round your response to three decmal places) \begin{tabular}{cccc} \hline SampleSize,n & MeanFactor,A2 & UpperRange,D4 & LowerRange,D3 \\ \hline 2 & 1.880 & 3268 & 0 \\ 3 & 1.023 & 2.574 & 0 \\ 4 & 0.729 & 2.282 & 0 \\ 5 & 0.577 & 2.115 & 0 \\ 6 & 0.483 & 2.004 & 0 \\ 7 & 0.419 & 1.924 & 0.076 \\ 8 & 0.373 & 1.864 & 0.136 \\ 9 & 9.337 & 1.816 & 0.184 \\ 10 & 0.508 & 1.777 & 0.223 \\ 12 & 0.266 & 1.716 & 0.284 \\ \hline \end{tabular}
Step by Step Solution
There are 3 Steps involved in it

Get step-by-step solutions from verified subject matter experts