

Question: Refer to Table S6.1 - Factors for Computing Control Chart Limits (3 sigma) for this problem. Twelve samples, each containing five parts, were taken from
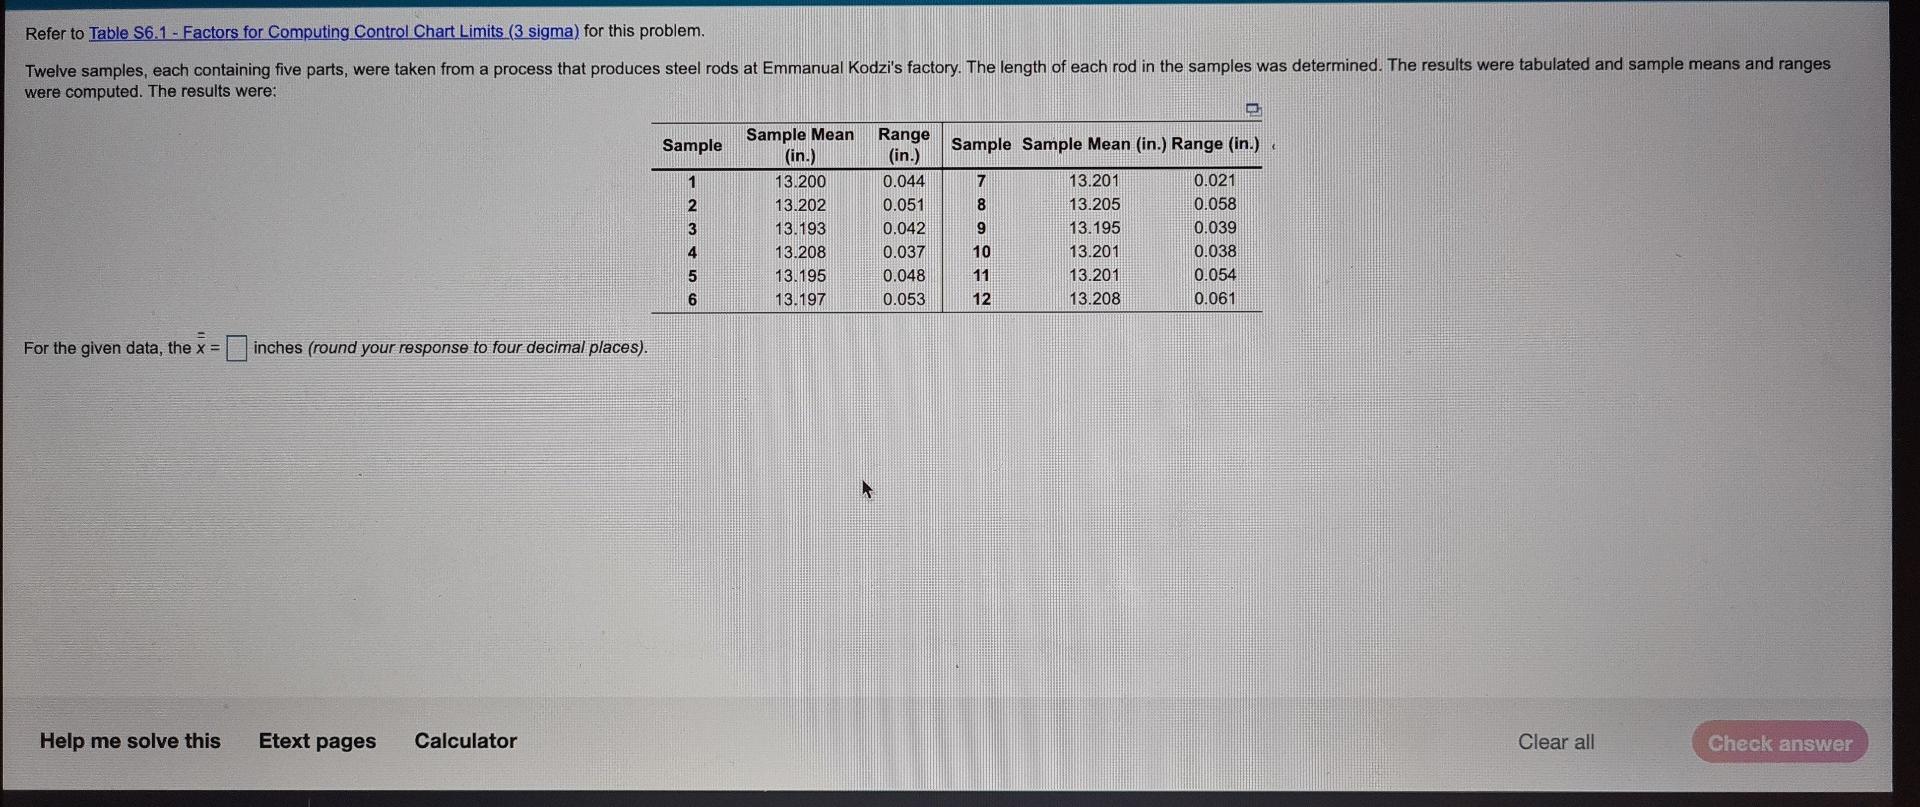
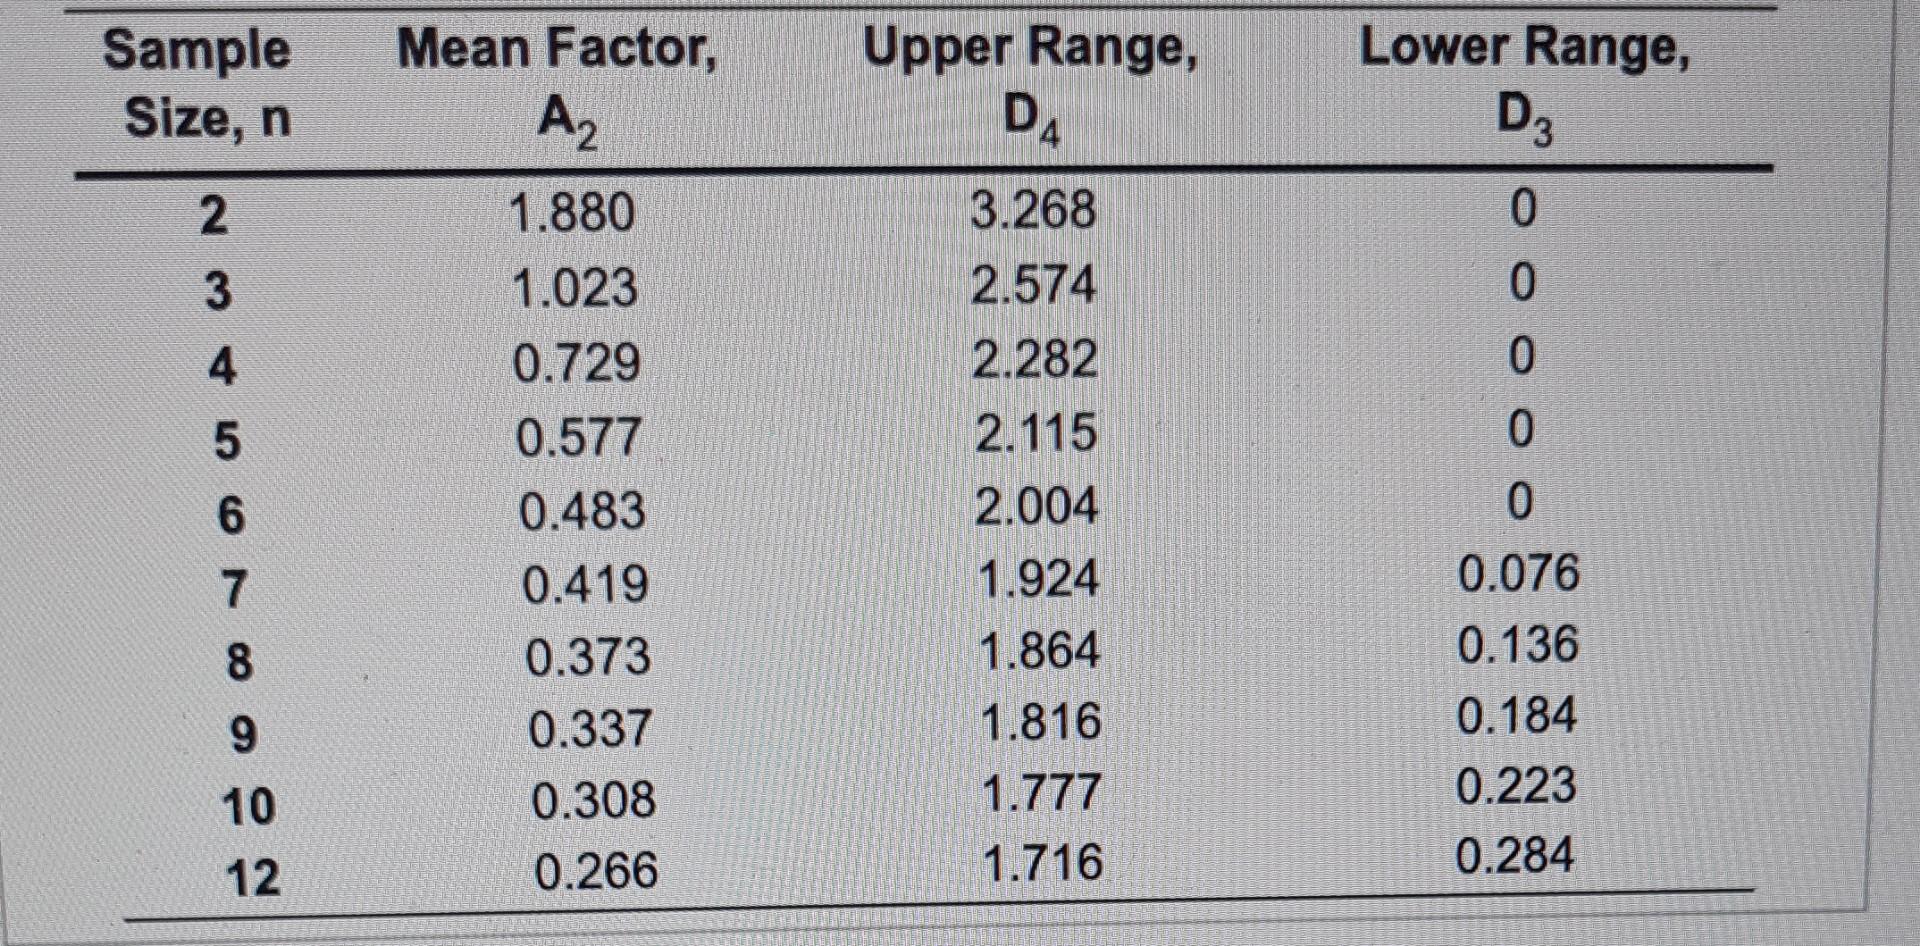
Refer to Table S6.1 - Factors for Computing Control Chart Limits (3 sigma) for this problem. Twelve samples, each containing five parts, were taken from a process that produces steel rods at Emmanual Kodzi's factory. The length of each rod in the samples was determined. The results were tabulated and sample means and ranges were computed. The results were: DRE Sample Sample Sample Mean (in.) Range (in.). 1 7 2 8 Sample Mean (in.) 13.200 13.202 13.193 13.208 13.195 13.197 Range (in.) 0.044 0.051 0.042 0.037 0.048 0.053 13.201 13.205 13.195 13.201 13.201 13.208 0.021 0.058 0.039 0.038 9 4 10 11 0.054 0.061 12 For the given data, the x = inches (round your response to four decimal places). Help me solve this Etext pages Calculator Clear all Check answer Sample Size, n Mean Factor, AZ Upper Range, DA Lower Range, D3 2 0 3 0 3.268 2.574 2.282 2.115 4 0 5 0 o oo o o a N 6 0 1.880 1.023 0.729 0.577 0.483 0.419 0.373 0.337 0.308 0.266 0.076 0.136 8 2.004 1.924 1.864 1.816 1.777 1.716 9 0.184 0.223 0.284 10 12
Step by Step Solution
There are 3 Steps involved in it
1 Expert Approved Answer
Step: 1 Unlock

Question Has Been Solved by an Expert!
Get step-by-step solutions from verified subject matter experts
Step: 2 Unlock
Step: 3 Unlock