

Question: Refer to the above graph. The solid sloping line represents the opportunities for investment in the capital market, where CF0=4,000 and CF1=5,000. Suppose Casper Smith
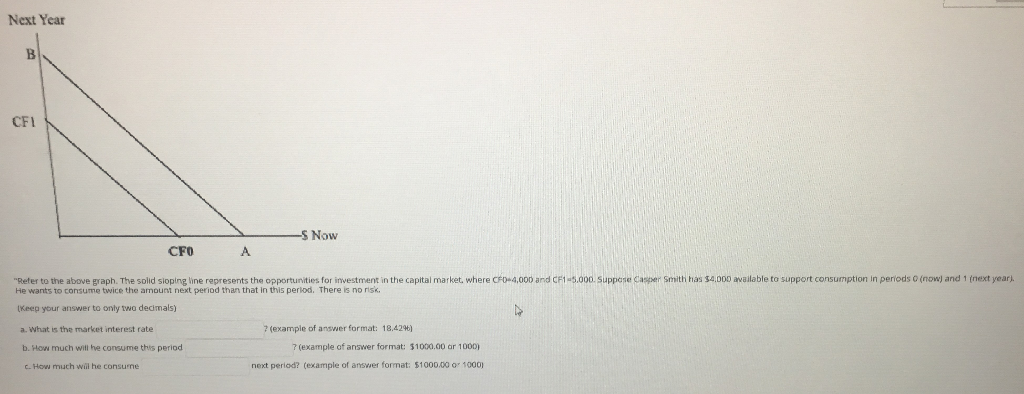
Refer to the above graph. The solid sloping line represents the opportunities for investment in the capital market, where CF0=4,000 and CF1=5,000. Suppose Casper Smith has $4,000 available to support consumption in periods 0 (now) and 1 (next year). He wants to consume twice the amount next period than that in this period. There is no risk.
(Keep your answer to only two decimals)
a. What is the market interest rate ? (example of answer format: 18.42%) b. How much will he consume this period ? (example of answer format: $1000.00 or 1000) c. How much will he consume next period? (example of answer format: $1000.00 or 1000)
Next Year B CF1 S Now CF0 A t in the capital market, where CFD-4,000 and CF1-5.000. Suppese Casper Smith has $4.000 available to support consumption in periods 0 (now) and 1 (next year). unities for investm consume twire the amount next period than that in this perlod. There is no risk. He wants i (Keep your answer to only two decimals) ? (example of answer format: 18,4296) a. What is the market interest rate 7 (example of answer format: $1000.00 ar 1000) b. How much witl he consume this period - How much wil he consume next period? (example of answer format: $1000.00 or 1000)
Step by Step Solution
There are 3 Steps involved in it

Get step-by-step solutions from verified subject matter experts