

Question: Refer to the accompanying scatterplot. a. Examine the pattern of all 10 points and subjectively determine whether there appears to be a strong correlation between
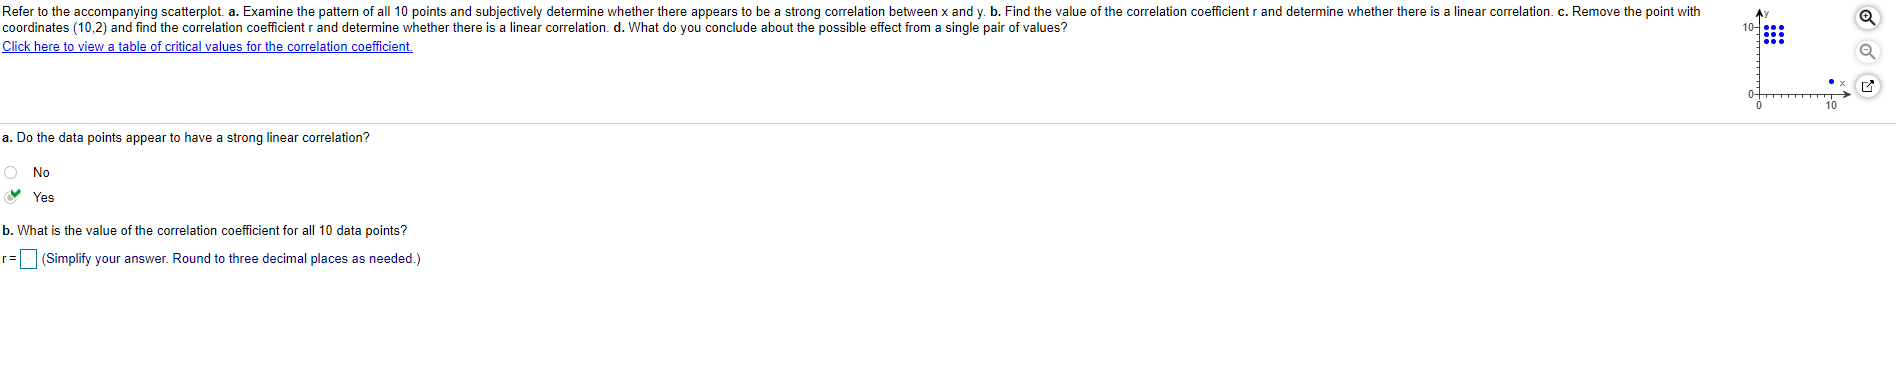
Refer to the accompanying scatterplot. a. Examine the pattern of all 10 points and subjectively determine whether there appears to be a strong correlation between x and y. b. Find the value of the correlation coefficient r and determine whether there is a linear correlation. c. Remove the point with coordinates (10,2) and find the correlation coefficient r and determine whether there is a linear correlation. d. What do you conclude about the possible effect from a single pair of values? Click here to view a table of critical values for the correlation coefficient. 10 a. Do the data points appear to have a strong linear correlation? O No Yes b. What is the value of the correlation coefficient for all 10 data points? r= (Simplify your answer. Round to three decimal places as needed.)
Step by Step Solution
There are 3 Steps involved in it

Get step-by-step solutions from verified subject matter experts