

Question: Refer to the accompanying scatterplot. a. Examine the pattern of all10 points and subjectively determine whether there appears to be a strong correlation between x
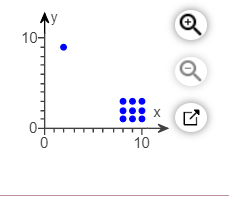
Refer to the accompanying scatterplot.
a. Examine the pattern of all10 points and subjectively determine whether there appears to be a strong correlation between x and y.
b. Find the value of the correlation coefficient r and determine whether there is a linear correlation.
c. Remove the point with coordinates(2,9) and find the correlation coefficient r and determine whether there is a linear correlation.
d. What do you conclude about the possible effect from a single pair ofvalues?
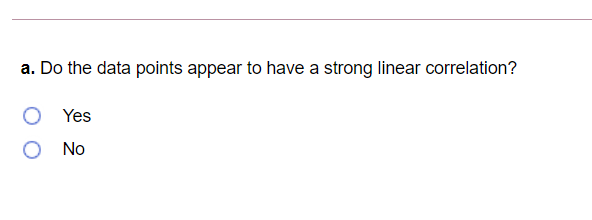
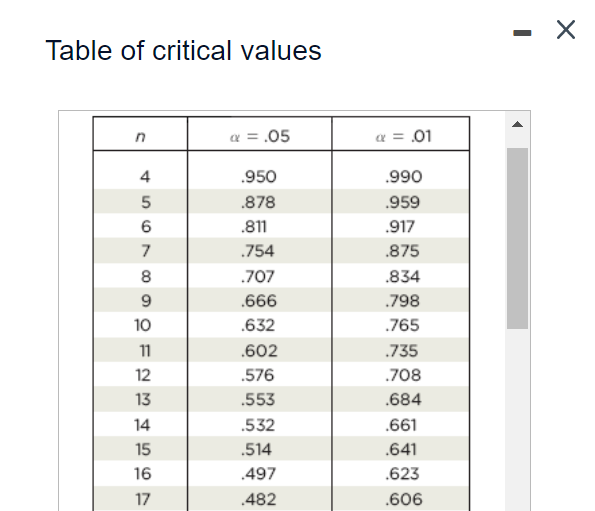
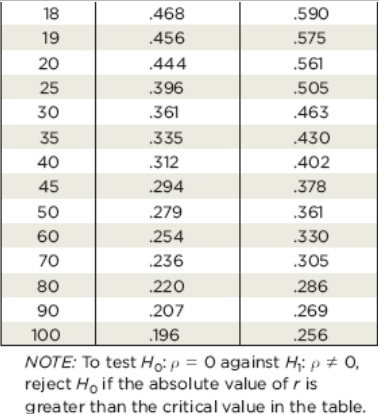
\fa. Do the data points appear to have a strong linear correlation? O Yes O No \f19 .456 .575 20 .44 4 .56l 25 3% .505 30 .36! '46 3 35 .335 .430 40 312 .402 45 .294 .375 50 .279 '361 50 .254 .330 70 .236 .305 more: To test Ho: p = 0 against H]: p at 0, reject Ho If the absolute value of r is greater than the critical value in the table
Step by Step Solution
There are 3 Steps involved in it

Get step-by-step solutions from verified subject matter experts