

Question: Refer to the attached Week 4 Graph for this assignment. The graph shows a relationship in supply (from S1 to S2 and in demand (from
Refer to the attached Week 4 Graph for this assignment. The graph shows a relationship in supply (from S1 to S2 and in demand (from D1 to D2). Discuss what is occurring on this graph. What happened with supply? Did it increase or decrease more than demand? Take into consideration the impact on quantity and price in your analysis.
Given your analysis, what would cause the situation to go the opposite way? What would cause the situation to go further into the same direction?
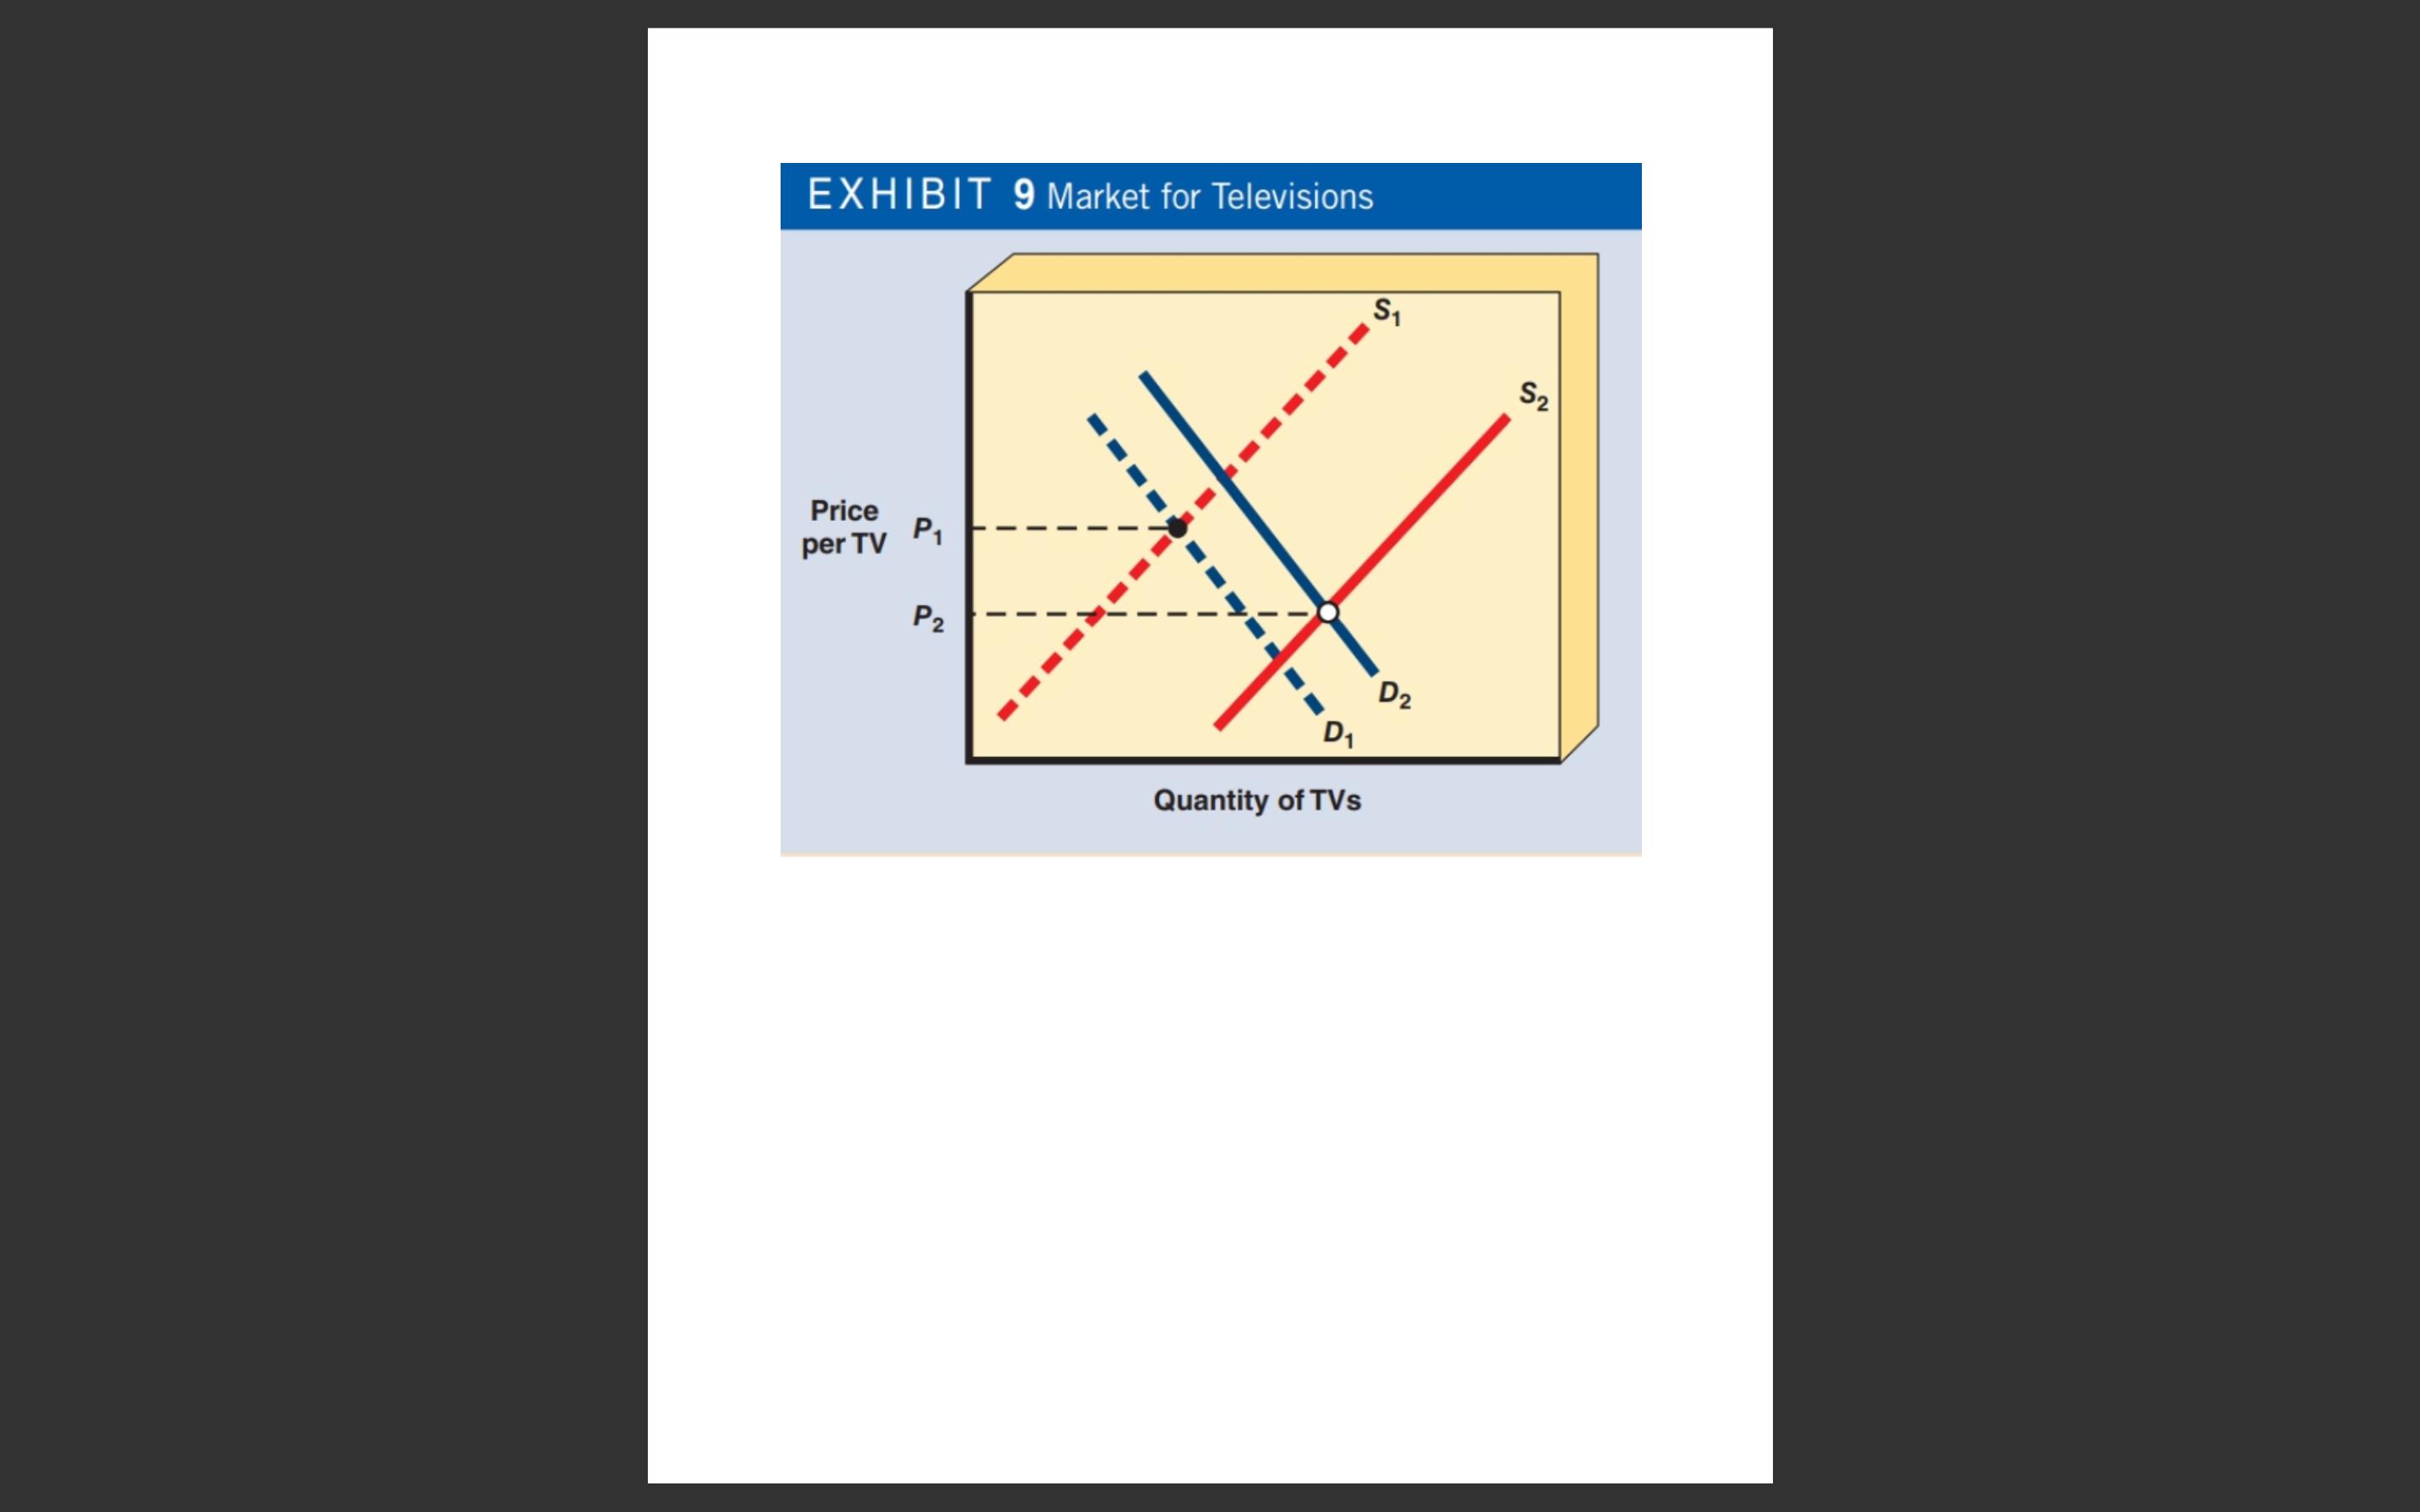
EXHIBIT 9 Market for Televisions Price P1 per TV P2 S D2 D1 Quantity of TVS S2
Step by Step Solution
There are 3 Steps involved in it
1 Expert Approved Answer
Step: 1 Unlock

Question Has Been Solved by an Expert!
Get step-by-step solutions from verified subject matter experts
Step: 2 Unlock
Step: 3 Unlock