Question: refer to the attachments 71 Consider a 2nd-order response surface model that contains the linear, pure quadratic and crossproduct terms as follows: 2 y. =
refer to the attachments
71
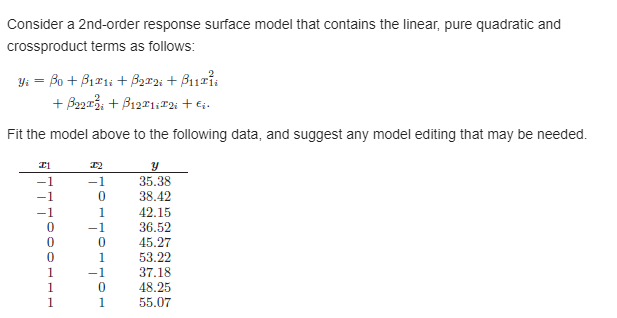
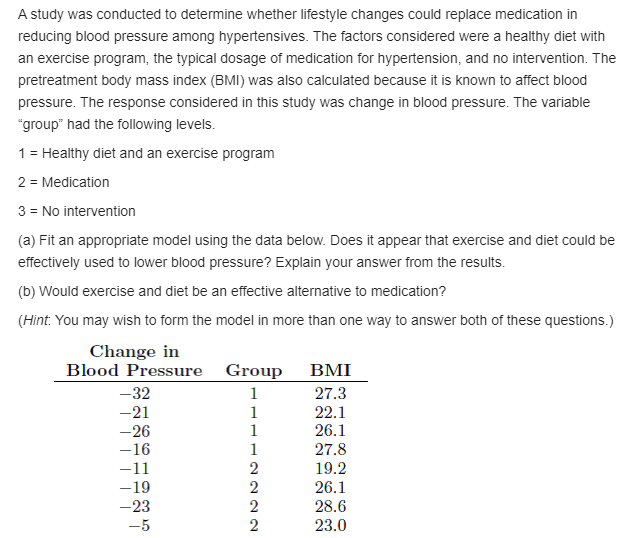
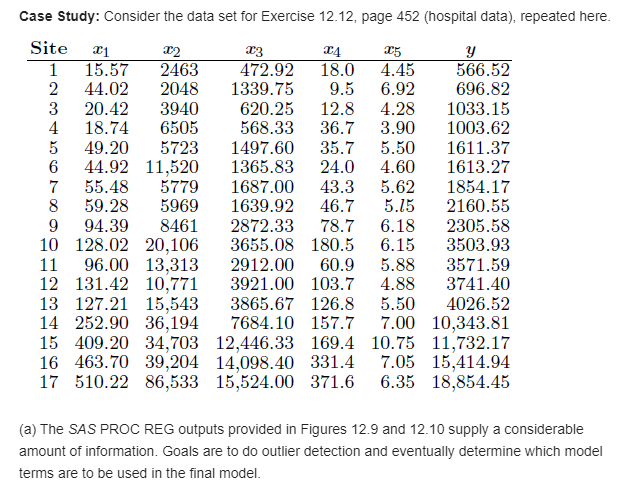
Consider a 2nd-order response surface model that contains the linear, pure quadratic and crossproduct terms as follows: 2 y. = n + .31311- + .3232.- + .31111a + .52421'5. + 31:31:12..- + Ea. Fit the model above to the followi ng data, and suggest an}:r model editing that may he needed. 1'1 1': y 1 l 35.33 1 l] 33.42 1 l 42.15 I] l 35.52 I] E] 45.2? I] l 53.22 1 l 3?.13 1 l] 43.25 1 1 55.0? A stud}:r was conducted to determine whether lifestyle changes oould replace medication in reducing blood pressure among hvpertensives. The factors considered were a heatthv diet with an exercise program, the typical dosage of medication for hypertension, and no intervention. The pretreatment body.r mass index [Elhlli was also calculated because it is ltnown to affect blood pressure. The response considered in this studyr was change in blood pressure. The variable \"group" had the following levels. 1 = Healthy.r diet and an exercise program 2 = Medication 3 = No intervention {a} Fit an appropriate model using the data below. Does it appear that exercise and diet oould be effectively:r used to lower blood pressure? Explain your answer from the results. {ti} Would exercise and diet be an effective alternative to medication? {Hint You mav wish to form the model in more than one way.r to answer both of these questions} Change in Blood Pressure Group BMI 32 1 27.3 21 1 22.1 25 1 212.1 l 1 27.8 11 2 19.2 19 2 26.1 23 2 28.6 5 2 23.0 Case Study: Consider the data set for Exercise 12.12, page 452 {hospital data}, repeated here. Site 1:1 mg :33 3:4 1:5 3:; 1 15.57 2463 472.92 18.9 4.45 566.52 44.92 2948 1339.75 9.5 6.92 696.82 29.42 3949 629.25 12.8 4.28 1933.15 18.74 6595 568.33 36. 7 3.99 1993.62 49.29 5723 1497.69 35.7 5.59 1611.37 44.92 11,529 1365.83 24.9 4.69 1613.27 55.48 5779 1687.99 43.3 5.62 1854.17 59.28 5969 1639.92 46.7 5.15 2169.55 94.39 8461 2872.33 78.7 6.18 2395.58 19 128.92 29,196 3655.98 189.5 6.15 3593.93 11 96.99 13,313 2912.99 69.9 5.88 3571.59 12 131.42 19,771 3921.99 193.7 4.88 3741.49 13 127.21 15,543 3865.67 126.8 5.59 4926.52 14 252.99 36,194 7684.19 157.7 7.99 19,343.81 15 499.29 34,793 12,446.33 169.4 19.75 11,732.17 16 463.79 39,294 14,998.49 331.4 7.95 15,414.94 17 519.22 86,533 15,524.99 371.6 6.35 18,854.45 snooqopsnemm {a} The see PRoo REG outputs provided in Figures 12.9 and 12.1o supply a considerable amount of information. Goals are to do outlier detection and eventuallyr determine which model terms are to be used in the nal model. \fA sociologist is concerned about the effectiveness of a training oourse designed to get more drivers to use seat belts in automobiles. {a} 1What hypothesis is she testing if she commits a type I error by erroneously concluding that the training course is ineffective? {b} 1v'vhat hypothesis is she testing if she commits a type II error by erroneously concluding that the training course is effective? \f\f