

Question: Refer to the figure below. First, explain why blue line (the line Item A is pointing at, i.e., line A) curves downward. Second, explain why
- Refer to the figure below. First, explain why blue line (the line Item A is pointing at, i.e., line A) curves downward. Second, explain why the purple line (the line Item B is pointing at, i.e., line B) lies below line A. Assume that the figure is for companies in the United States (where they use a classical tax system). If the tax authority in the US adopted the imputation system like in New Zealand, how would the line A change? How would this affect the optimal leverage levels of the US firms? (Word limit: 250)
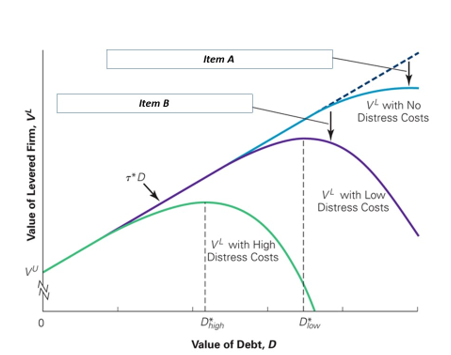
Item A Item B V with No Distress Costs Value of Levered Firm, VL TD VL with Low Distress Costs VL with High Distress Costs vi 0 Diw Dhigh Value of Debt, D Item A Item B V with No Distress Costs Value of Levered Firm, VL TD VL with Low Distress Costs VL with High Distress Costs vi 0 Diw Dhigh Value of Debt, D
Step by Step Solution
There are 3 Steps involved in it
1 Expert Approved Answer
Step: 1 Unlock

Question Has Been Solved by an Expert!
Get step-by-step solutions from verified subject matter experts
Step: 2 Unlock
Step: 3 Unlock