

Question: refer to the graph below, please demonstrate the three questions . Please explain thoroughly . Given the graph below showing the production possibilities frontier for
refer to the graph below, please demonstrate the three questions . Please explain thoroughly .
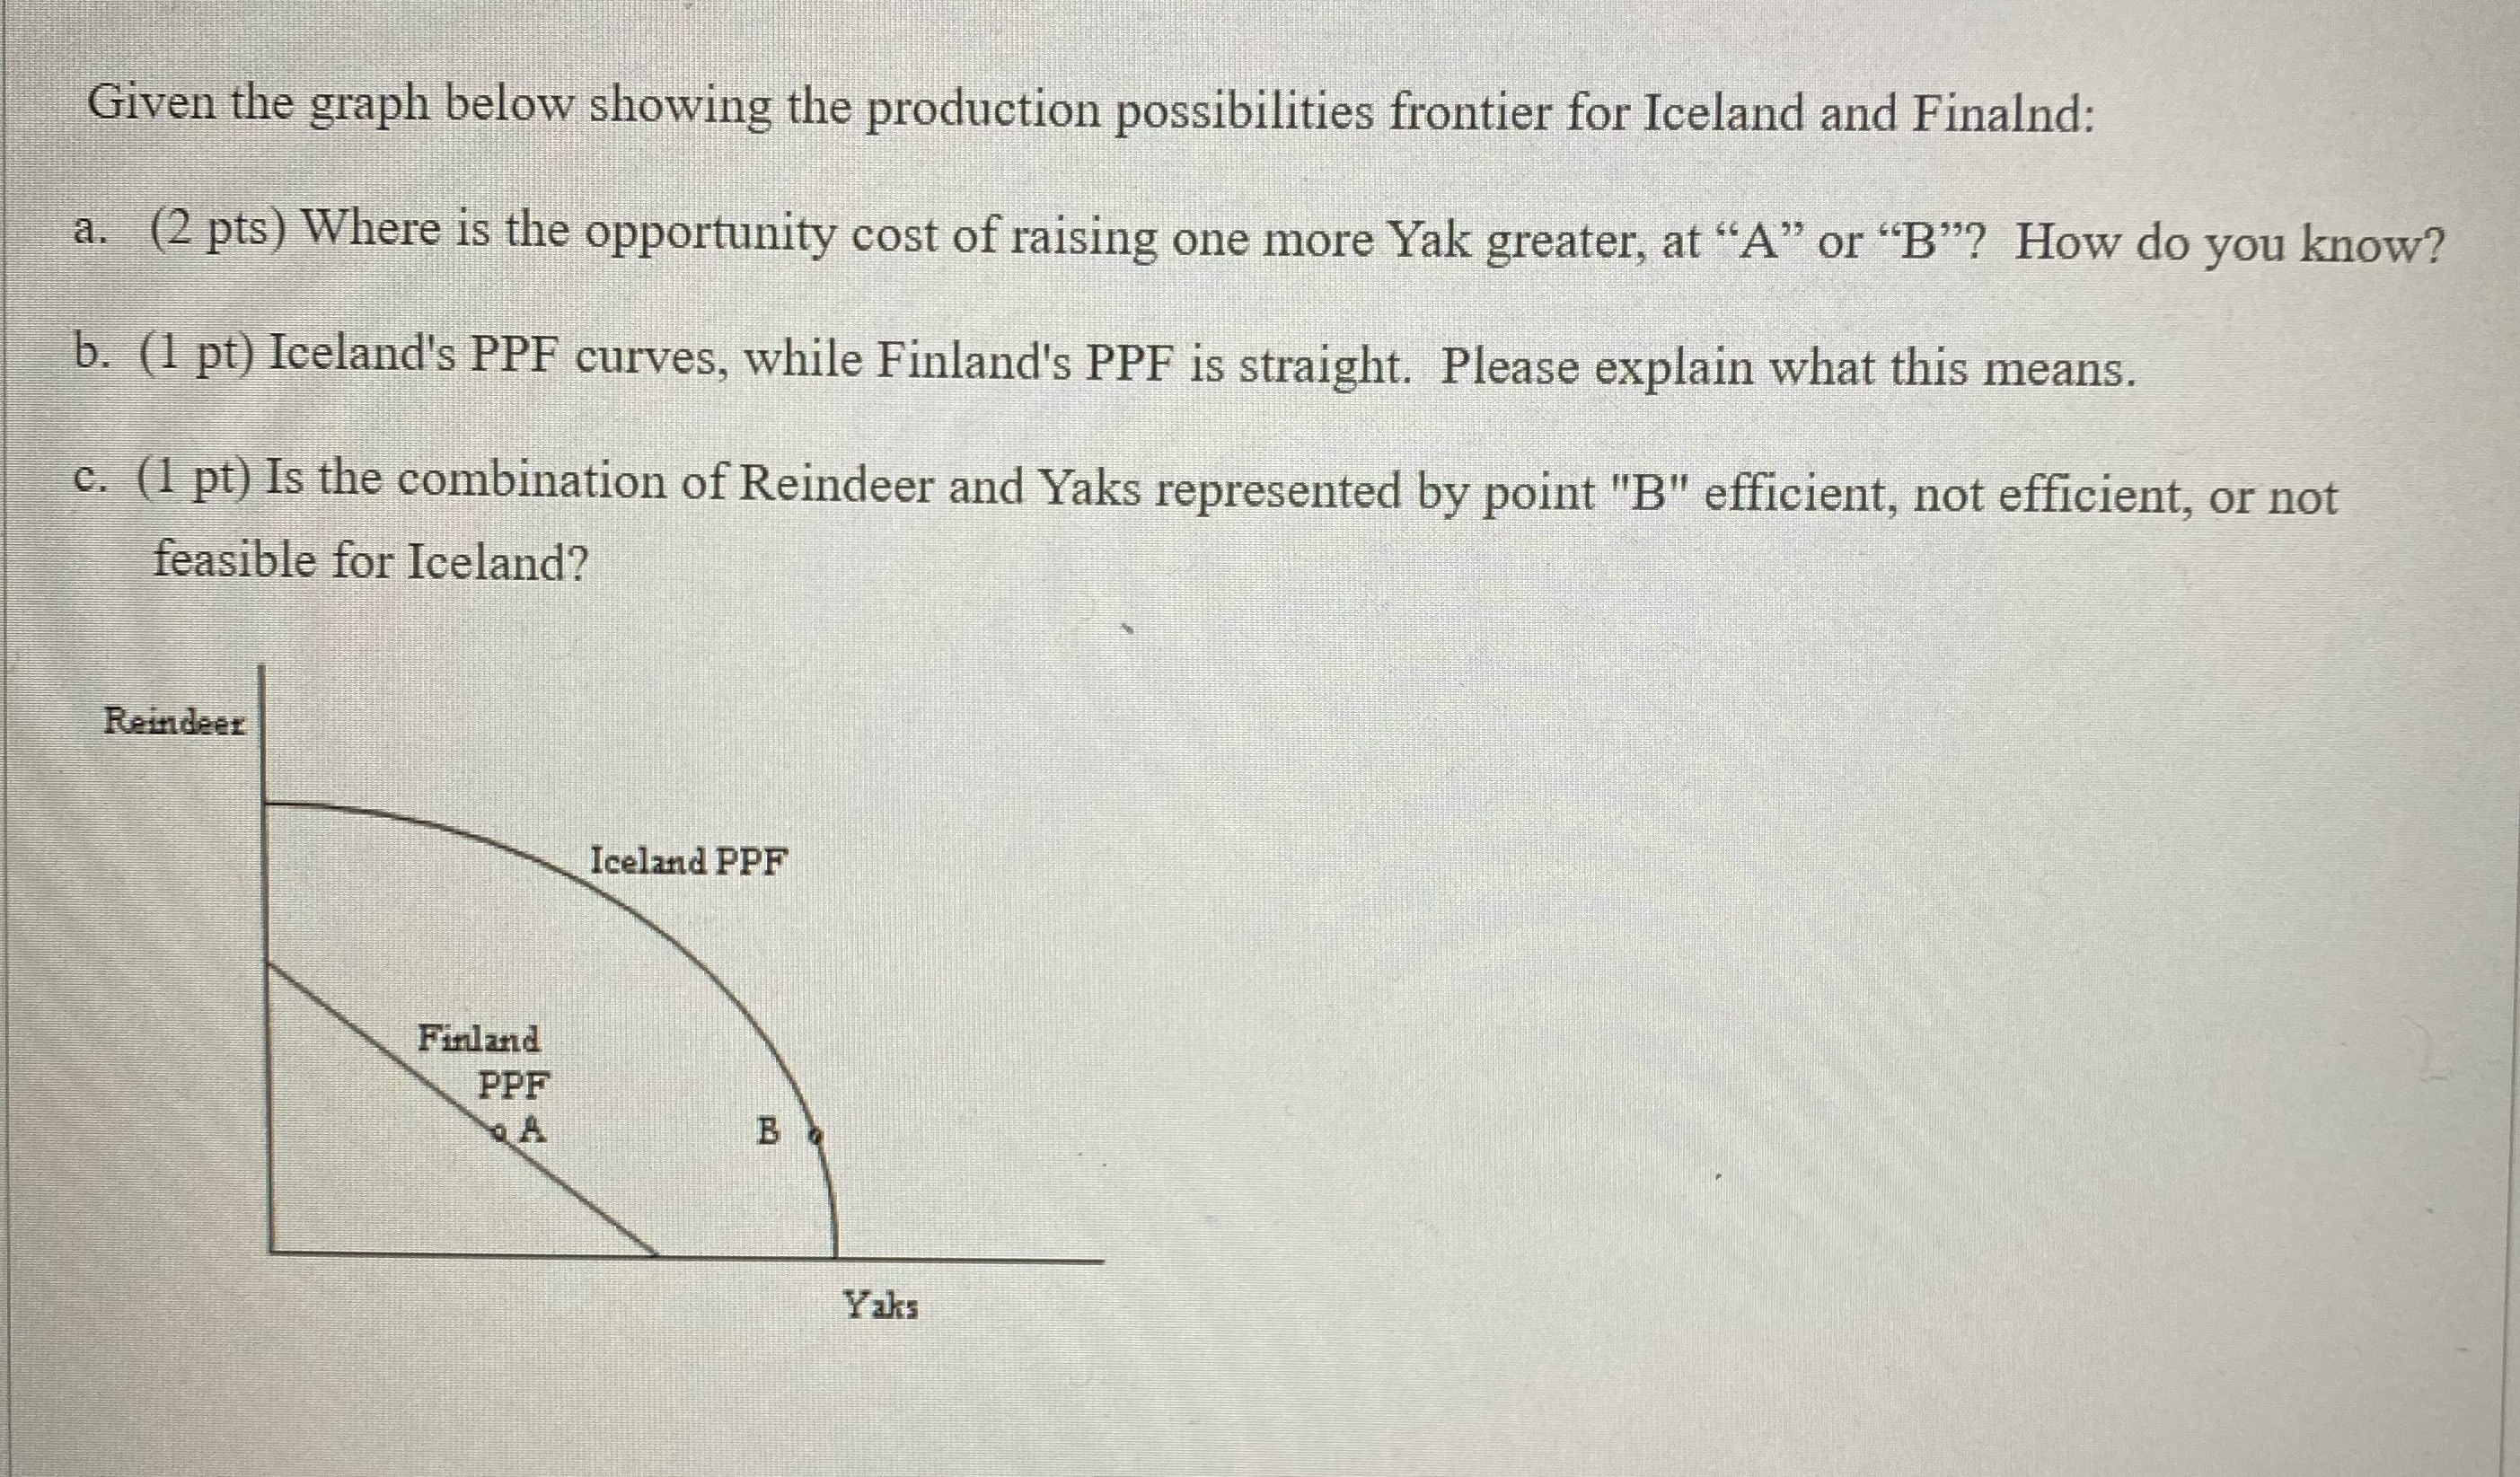
Given the graph below showing the production possibilities frontier for Iceland and Finalnd: a. (2 pts) Where is the opportunity cost of raising one more Yak greater, at "A" or "B"? How do you know? b. (1 pt) Iceland's PPF curves, while Finland's PPF is straight. Please explain what this means. c. (1 pt) Is the combination of Reindeer and Yaks represented by point "B" efficient, not efficient, or not feasible for Iceland? Reindeer Iceland PPF Finland PPF B Yaks
Step by Step Solution
There are 3 Steps involved in it
1 Expert Approved Answer
Step: 1 Unlock

Question Has Been Solved by an Expert!
Get step-by-step solutions from verified subject matter experts
Step: 2 Unlock
Step: 3 Unlock