

Question: Refer to the image showing four normal quantile plots below. III. IV. Which of the normal quantile plots indicates that the data have a bimodal

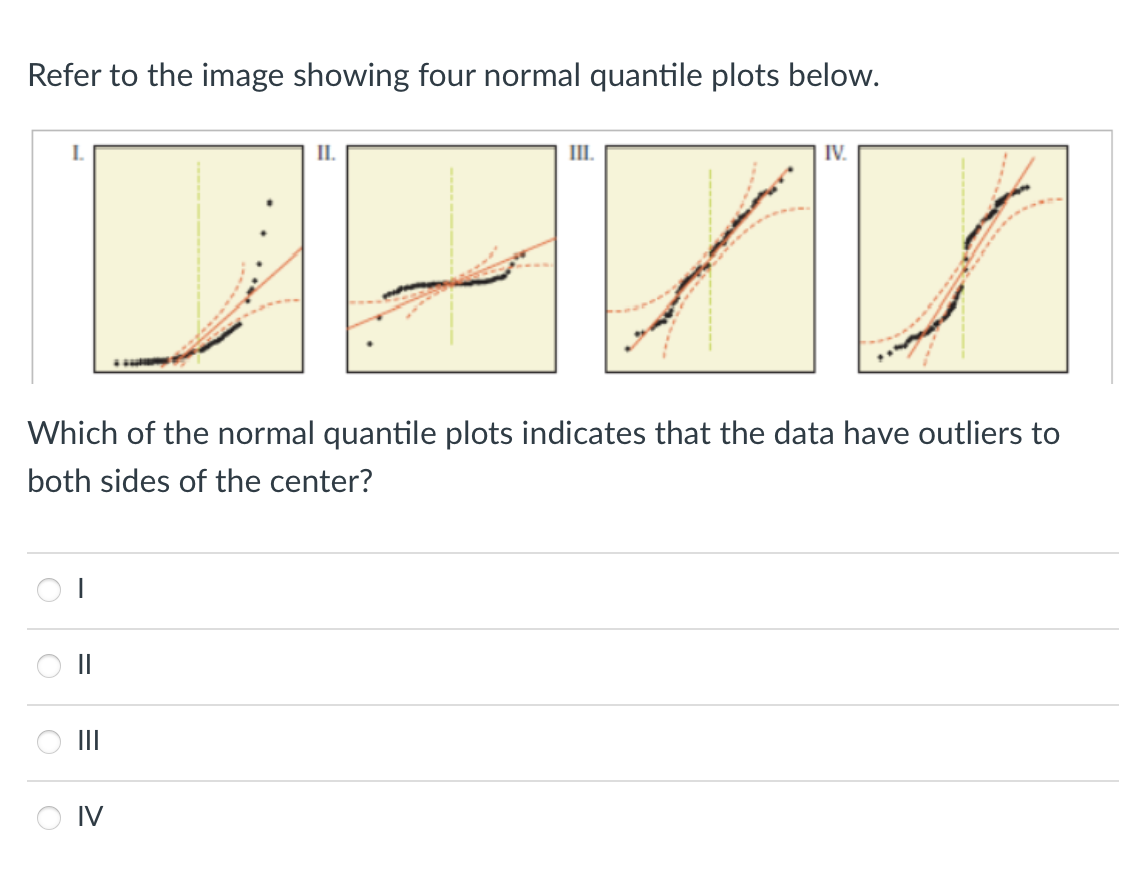

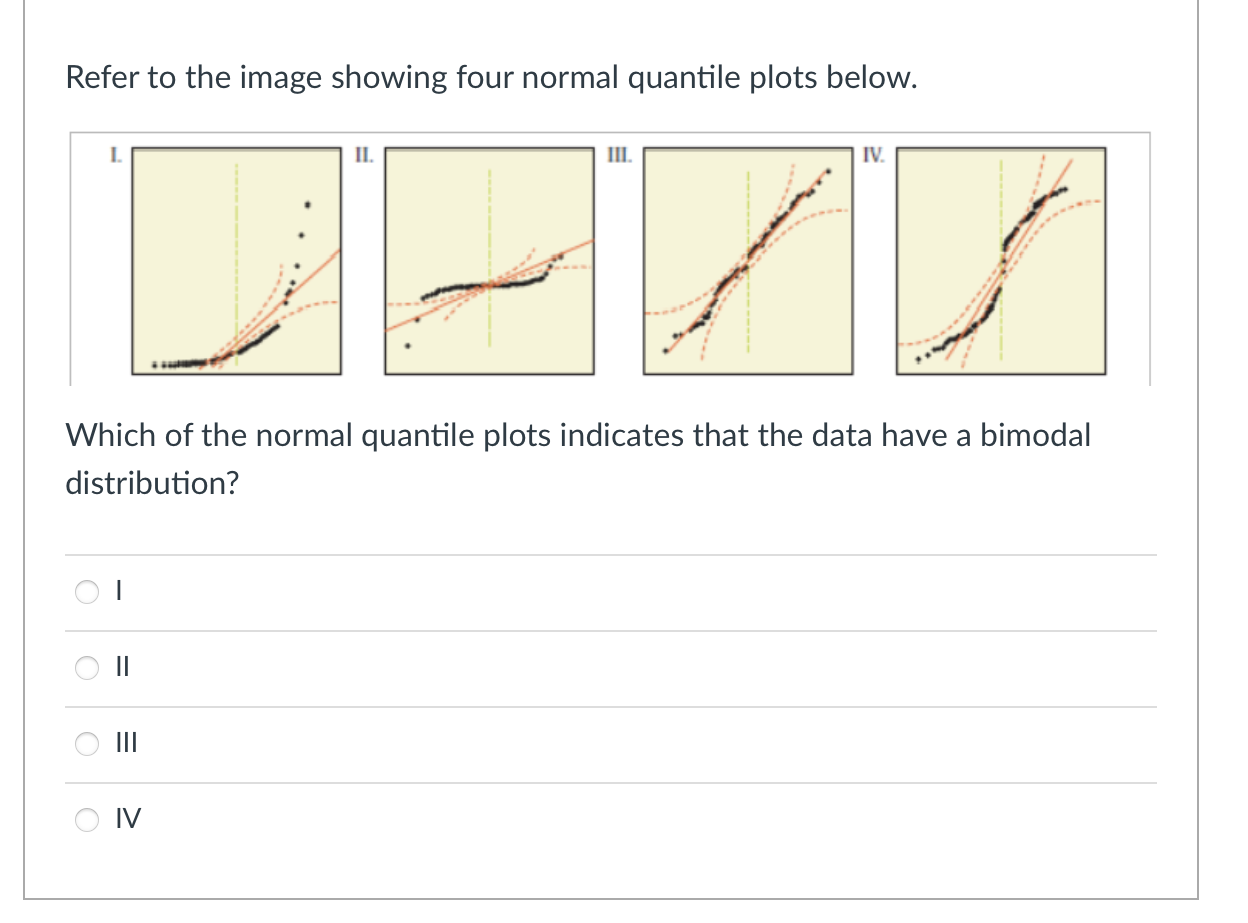

Refer to the image showing four normal quantile plots below. III. IV. Which of the normal quantile plots indicates that the data have a bimodal distribution? OI O II O III O IVRefer to the image showing four normal quantile plots below. Which of the normal quantile plots indicates that the data have outliers to both sides of the center? \"F\" I\" At a computer manufacturing company, the actual size of computer chips is normally distributed with a mean of 1 centimeter and a standard deviation of 0.1 centimeter. A random sample of 12 computer chips is taken. What is the probability that the sample mean will be below 0.95 centimeters? 0.9583 0.0321 0.0416 0.0217
Step by Step Solution
There are 3 Steps involved in it

Get step-by-step solutions from verified subject matter experts