

Question: Refer to the intersection shown above and considering three phase design (as shown below) and the given information provided below, determine the following requirements. Recommended
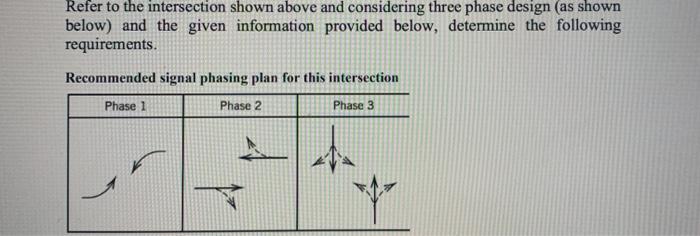
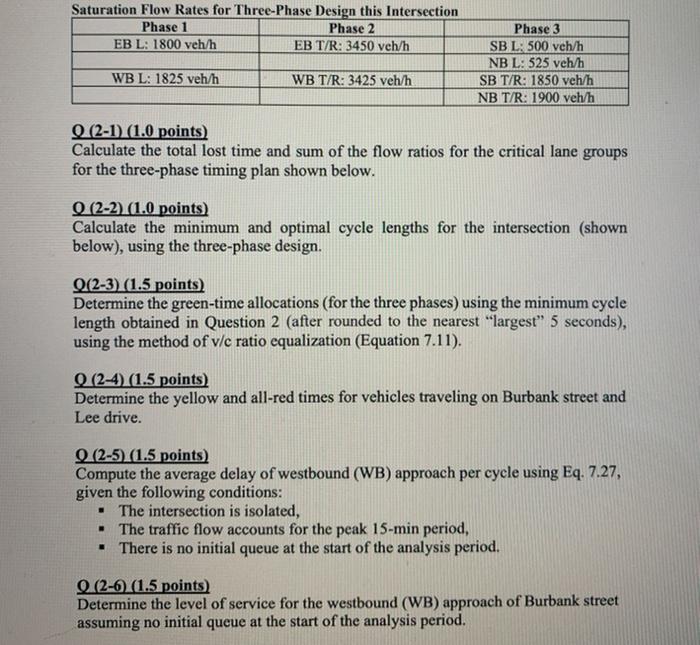
Refer to the intersection shown above and considering three phase design (as shown below) and the given information provided below, determine the following requirements. Recommended signal phasing plan for this intersection Phase 1 Phase 2 Phase 3 ata Saturation Flow Rates for Three-Phase Design this Intersection Phase 1 Phase 2 EB L: 1800 veh/h EB T/R: 3450 veh/h Phase 3 SB L: 500 veh/h NB L: 525 veh/h SB T/R: 1850 veh/h NB T/R: 1900 veh/h WB L: 1825 veh/h WB T/R: 3425 veh/h (2-1) (1.0 points) Calculate the total lost time and sum of the flow ratios for the critical lane groups for the three-phase timing plan shown below. O (2-2) (1.0 points) Calculate the minimum and optimal cycle lengths for the intersection (shown below), using the three-phase design. Q(2-3) (1.5 points) Determine the green-time allocations (for the three phases) using the minimum cycle length obtained in Question 2 (after rounded to the nearest largest" 5 seconds), using the method of v/c ratio equalization (Equation 7.11). (2-4 (1.5 points) Determine the yellow and all-red times for vehicles traveling on Burbank street and Lee drive. Q (2-5) (1.5 points) Compute the average delay of westbound (WB) approach per cycle using Eq.7.27, given the following conditions: . The intersection is isolated, The traffic flow accounts for the peak 15-min period, . There is no initial queue at the start of the analysis period. Q (2-6 (1.5 points) Determine the level of service for the westbound (WB) approach of Burbank street assuming no initial queue at the start of the analysis period. Refer to the intersection shown above and considering three phase design (as shown below) and the given information provided below, determine the following requirements. Recommended signal phasing plan for this intersection Phase 1 Phase 2 Phase 3 ata Saturation Flow Rates for Three-Phase Design this Intersection Phase 1 Phase 2 EB L: 1800 veh/h EB T/R: 3450 veh/h Phase 3 SB L: 500 veh/h NB L: 525 veh/h SB T/R: 1850 veh/h NB T/R: 1900 veh/h WB L: 1825 veh/h WB T/R: 3425 veh/h (2-1) (1.0 points) Calculate the total lost time and sum of the flow ratios for the critical lane groups for the three-phase timing plan shown below. O (2-2) (1.0 points) Calculate the minimum and optimal cycle lengths for the intersection (shown below), using the three-phase design. Q(2-3) (1.5 points) Determine the green-time allocations (for the three phases) using the minimum cycle length obtained in Question 2 (after rounded to the nearest largest" 5 seconds), using the method of v/c ratio equalization (Equation 7.11). (2-4 (1.5 points) Determine the yellow and all-red times for vehicles traveling on Burbank street and Lee drive. Q (2-5) (1.5 points) Compute the average delay of westbound (WB) approach per cycle using Eq.7.27, given the following conditions: . The intersection is isolated, The traffic flow accounts for the peak 15-min period, . There is no initial queue at the start of the analysis period. Q (2-6 (1.5 points) Determine the level of service for the westbound (WB) approach of Burbank street assuming no initial queue at the start of the analysis period
Step by Step Solution
There are 3 Steps involved in it

Get step-by-step solutions from verified subject matter experts