

Refer to the North Valley Real Estate data, which report information on homes sold during the...
Fantastic news! We've Found the answer you've been seeking!
Question:
Transcribed Image Text:
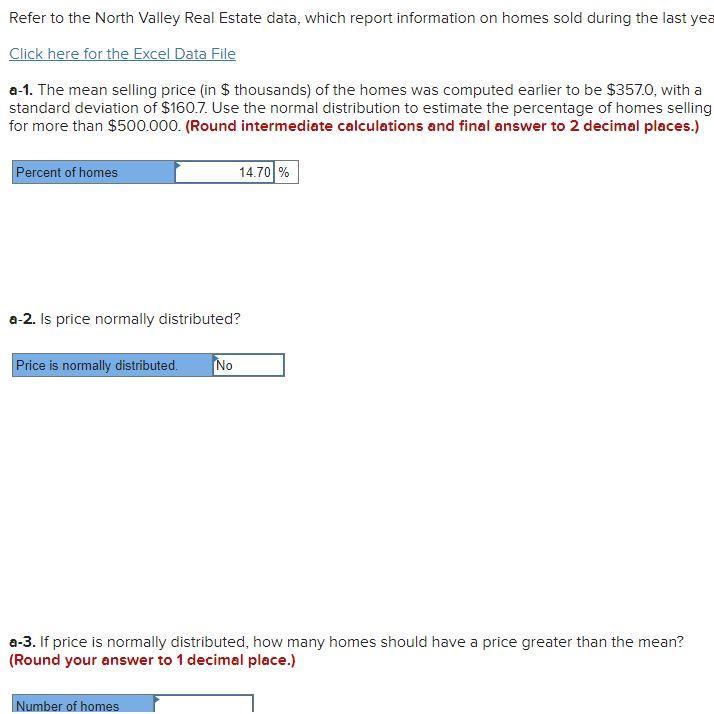
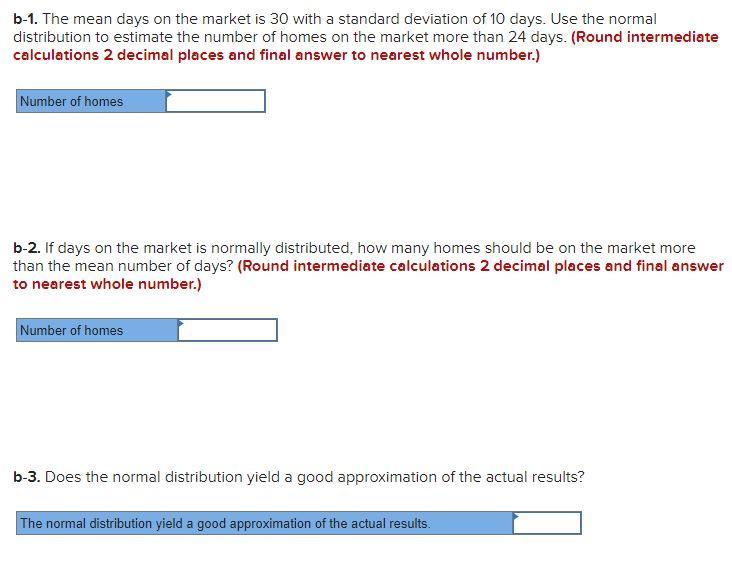
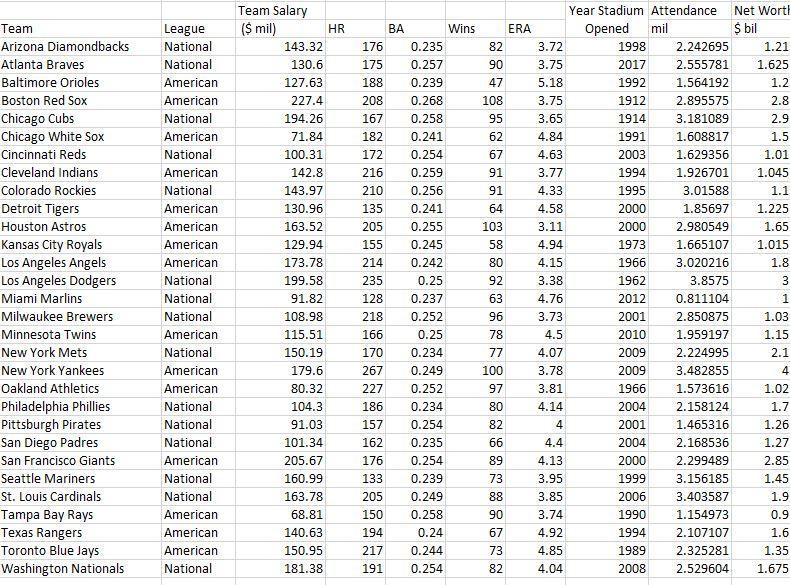
Refer to the North Valley Real Estate data, which report information on homes sold during the last yea Click here for the Excel Data File a-1. The mean selling price (in $ thousands) of the homes was computed earlier to be $357.0, with a standard deviation of $160.7. Use the normal distribution to estimate the percentage of homes selling for more than $500.000. (Round intermediate calculations and final answer to 2 decimal places.) Percent of homes a-2. Is price normally distributed? Price is normally distributed. No 14.70 % a-3. If price is normally distributed, how many homes should have a price greater than the mean? (Round your answer to 1 decimal place.) Number of homes b-1. The mean days on the market is 30 with a standard deviation of 10 days. Use the normal distribution to estimate the number of homes on the market more than 24 days. (Round intermediate calculations 2 decimal places and final answer to nearest whole number.) Number of homes b-2. If days on the market is normally distributed, how many homes should be on the market more than the mean number of days? (Round intermediate calculations 2 decimal places and final answer to nearest whole number.) Number of homes b-3. Does the normal distribution yield a good approximation of the actual results? The normal distribution yield a good approximation of the actual results. Team Arizona Diamondbacks Atlanta Braves Baltimore Orioles Boston Red Sox Chicago Cubs Chicago White Sox Cincinnati Reds Cleveland Indians Colorado Rockies Detroit Tigers Houston Astros Kansas City Royals Los Angeles Angels Los Angeles Dodgers Miami Marlins Milwaukee Brewers Minnesota Twins New York Mets New York Yankees Oakland Athletics Philadelphia Phillies Pittsburgh Pirates San Diego Padres San Francisco Giants Seattle Mariners St. Louis Cardinals Tampa Bay Rays Texas Rangers Toronto Blue Jays Washington Nationals League National National American American National American National American National American American American American National National National American National American American National National National American National National American American American National Team Salary ($ mil) 143.32 130.6 127.63 227.4 194.26 71.84 100.31 142.8 143.97 130.96 163.52 129.94 173.78. 199.58 91.82 108.98 115.51 150.19 179.6 80.32 104.3 91.03 101.34 205.67 160.99 163.78 68.81 140.63 150.95 181.38 HR BA 176 0.235 175 0.257 188 0.239 208 0.268 167 0.258 182 0.241 172 0.254 216 0.259 0.256 210 135 0.241 205 0.255 0.245 155 214 0.242 0.25 235 128 0.237 0.252 218 166 0.25 170 0.234 267 0.249 227 0.252 186 0.234 0.235 157 0.254 162 176 0.254 133 0.239 205 0.249 150 0.258 194 0.24 217 0.244 191 0.254 Wins 82 90 47 108 95 62 67 91 91 4.84 4.63 3.77 4.33 4.58 3.11 4.94 4.15 3.38 4.76 3.73 4.5 4.07 3.78 3.81 4.14 4 4.4 89 4.13 73 3.95 88 3.85 3.74 4.92 4.85 4.04 64 103 58 80 92 63 96 78 77 100 97 80 82 66 90 67 ERA 73 82 3.72 3.75 5.18 3.75 3.65 Year Stadium Attendance Net Worth Opened mil Ś bil 2.242695 1.21 2.555781 1.625 1.564192 1.2 2.895575 2.8 2.9 1.5 1.01 1.045 1995 1.1 2000 1.225 1.65 2000 2.980549 1973 1.665107 1.015 1966 3.020216 1962 3.8575 2012 0.811104 2001 2.850875 2010 1.959197 2009 2.224995 2009 3.482855 1966 1.573616 2004 2.158124 2001 1.465316 2004 2.168536 2000 2.299489 1999 3.156185 2006 3.403587 1990 1.154973 1994 2.107107 1989 2.325281 2008 2.529604 1998 2017 1992 1912 1914 1991 2003 1994 3.181089 1.608817 1.629356 1.926701 3.01588 1.85697 1.8 3 1 1.03 1.15 2.1 4 1.02 1.7 1.26 1.27 2.85 1.45 1.9 0.9 1.6 1.35 1.675 Refer to the North Valley Real Estate data, which report information on homes sold during the last yea Click here for the Excel Data File a-1. The mean selling price (in $ thousands) of the homes was computed earlier to be $357.0, with a standard deviation of $160.7. Use the normal distribution to estimate the percentage of homes selling for more than $500.000. (Round intermediate calculations and final answer to 2 decimal places.) Percent of homes a-2. Is price normally distributed? Price is normally distributed. No 14.70 % a-3. If price is normally distributed, how many homes should have a price greater than the mean? (Round your answer to 1 decimal place.) Number of homes b-1. The mean days on the market is 30 with a standard deviation of 10 days. Use the normal distribution to estimate the number of homes on the market more than 24 days. (Round intermediate calculations 2 decimal places and final answer to nearest whole number.) Number of homes b-2. If days on the market is normally distributed, how many homes should be on the market more than the mean number of days? (Round intermediate calculations 2 decimal places and final answer to nearest whole number.) Number of homes b-3. Does the normal distribution yield a good approximation of the actual results? The normal distribution yield a good approximation of the actual results. Team Arizona Diamondbacks Atlanta Braves Baltimore Orioles Boston Red Sox Chicago Cubs Chicago White Sox Cincinnati Reds Cleveland Indians Colorado Rockies Detroit Tigers Houston Astros Kansas City Royals Los Angeles Angels Los Angeles Dodgers Miami Marlins Milwaukee Brewers Minnesota Twins New York Mets New York Yankees Oakland Athletics Philadelphia Phillies Pittsburgh Pirates San Diego Padres San Francisco Giants Seattle Mariners St. Louis Cardinals Tampa Bay Rays Texas Rangers Toronto Blue Jays Washington Nationals League National National American American National American National American National American American American American National National National American National American American National National National American National National American American American National Team Salary ($ mil) 143.32 130.6 127.63 227.4 194.26 71.84 100.31 142.8 143.97 130.96 163.52 129.94 173.78. 199.58 91.82 108.98 115.51 150.19 179.6 80.32 104.3 91.03 101.34 205.67 160.99 163.78 68.81 140.63 150.95 181.38 HR BA 176 0.235 175 0.257 188 0.239 208 0.268 167 0.258 182 0.241 172 0.254 216 0.259 0.256 210 135 0.241 205 0.255 0.245 155 214 0.242 0.25 235 128 0.237 0.252 218 166 0.25 170 0.234 267 0.249 227 0.252 186 0.234 0.235 157 0.254 162 176 0.254 133 0.239 205 0.249 150 0.258 194 0.24 217 0.244 191 0.254 Wins 82 90 47 108 95 62 67 91 91 4.84 4.63 3.77 4.33 4.58 3.11 4.94 4.15 3.38 4.76 3.73 4.5 4.07 3.78 3.81 4.14 4 4.4 89 4.13 73 3.95 88 3.85 3.74 4.92 4.85 4.04 64 103 58 80 92 63 96 78 77 100 97 80 82 66 90 67 ERA 73 82 3.72 3.75 5.18 3.75 3.65 Year Stadium Attendance Net Worth Opened mil Ś bil 2.242695 1.21 2.555781 1.625 1.564192 1.2 2.895575 2.8 2.9 1.5 1.01 1.045 1995 1.1 2000 1.225 1.65 2000 2.980549 1973 1.665107 1.015 1966 3.020216 1962 3.8575 2012 0.811104 2001 2.850875 2010 1.959197 2009 2.224995 2009 3.482855 1966 1.573616 2004 2.158124 2001 1.465316 2004 2.168536 2000 2.299489 1999 3.156185 2006 3.403587 1990 1.154973 1994 2.107107 1989 2.325281 2008 2.529604 1998 2017 1992 1912 1914 1991 2003 1994 3.181089 1.608817 1.629356 1.926701 3.01588 1.85697 1.8 3 1 1.03 1.15 2.1 4 1.02 1.7 1.26 1.27 2.85 1.45 1.9 0.9 1.6 1.35 1.675
Expert Answer:
Answer rating: 100% (QA)
a 1 mean M 357 standard deviation 0 1607 Using a normal dutribut... View the full answer

Related Book For 

Statistical Techniques In Business And Economics
ISBN: 9781260239478
18th Edition
Authors: Douglas Lind, William Marchal, Samuel Wathen
Posted Date:
Students also viewed these mathematics questions
-
Refer to the North Valley Real Estate data and prepare a report on the sales prices of the homes. Be sure to answer the following questions in your report. a. Around what values of price do the data...
-
Refer to the North Valley Real Estate data, which report information on homes sold during the last year. For the variable price, select an appropriate class interval and organize the selling prices...
-
Refer to the North Valley Real Estate data, which report information on homes sold during the last year. a. Sort the data into a table that shows the number of homes that have a pool versus the...
-
Suppose you wanted to hasten the transition from a depletable fossil fuel to solar energy. Compare the effects of a per-unit tax on the depletable resource to an equivalent per-unit subsidy on solar...
-
Suppose the government misjudges the natural rate of unemployment to be much lower than it actually is, and thus undertakes expansionary fiscal and monetary policies to try to achieve the lower rate....
-
Bacteria growing in a batch reactor utilize a soluble food source (substrate) as depicted in Fig. P28.16. The uptake of the substrate is represented by a logistic model with Michaelis-Menten...
-
A test of homogeneity is performed and the null hypothesis is rejected. True or false: We can conclude that the distributions are not the same in every row.
-
Biofuel Inc. (BI) is a private company that just started up this year. The company's owner, Sarah Biorini, created a process whereby carbon dioxide (CO,) emissions are converted into biofuel....
-
A colleague states that the 'traditional NPV method is just as effective as an NPV method incorporating probabilities and real option perspectives'. Critically evaluate this statement
-
How can a nurse aide identify Mr. James’s medical problems, his emotional and physical needs, and deal with these problems? Pay close attention to safety issues specific for an individual who...
-
Design a 4x16 line decoder using 2x4 line decoders.
-
The input to a LTI DTS is given below (a) Show that if h(n) is a FIR oflength L points, y(n+5)= y(n) for all n>L-1(b) Plot one cycle of output after output has reached aperiodic steady state in the...
-
5. Show your math and solve for the expected values at each node, then use Excel QM or QM for windows to generate a decision tree and table of results. Investment A (-$70,000) 2 Investment B...
-
Consider the following table, which gives a security analyst's expected return on two stocks for two particular market returns: Market Return 7% 21 Aggressive Stock -4% 38 Defensive Stock 7% 10 a....
-
Write 3 paragraphs, what is an example of a company doing good by doing well that is, making profits and for that reason improving the general welfare? How can the example be converted into an...
-
Given: k1= 80 N/mm, k2 = 100 N/mm, k3 = 160 N/mm, F3 = 200 N, F4 = 100 N, and nodes 1 and 2 are fix a. Global stiffness matrix b. Displacements of nodes 3 and 4 c. Reaction Forces at nodes 1 and 2 k...
-
Is it possible to "fly" by holding on to enough helium-filled balloons? Consider a 28-cm-diameter helium balloon at 20C. Use PHe = 0.166 kg/m. What is the net upward force on the balloon? How many...
-
A sprinkler head malfunctions at midfield in an NFL football field. The puddle of water forms a circular pattern around the sprinkler head with a radius in yards that grows as a function of time, in...
-
Each of three supermarket chains in the Denver area claims to have the lowest overall prices. As part of an investigative study on supermarket advertising, a local television station conducted a...
-
Listed are the net sales (in millions of euros) for the Adidas Group from 2011 to 2018. Year Net Sales 2011 . . . . . . . . . . . . . . . . . . . . . . 13,322 2012 . . . . . . . . . . . . . . . . . ....
-
In 2018, the U.S. Department of Agriculture issued a report (http://www.cnpp.usda.gov/ sites/default/files/CostofFoodNov2018.pdf) indicating a family of four spent an average of $1,054.50 per month...
-
What is the difference between a primary beneficiary relationship and a foreseen party relationship?
-
What is the difference between a privity relationship and a primary beneficiary relationship?
-
What is the difference between a foreseen party relationship and a foreseeable party relationship?

Study smarter with the SolutionInn App