

Question: Refer to the salesforce.com financial statement excerpts given below to answer the questions. On January 31, 2019, the price of salesforce.com stock was $151.97, and
Refer to the salesforce.com financial statement excerpts given below to answer the questions. On January 31, 2019, the price of salesforce.com stock was $151.97, and there were 770 million shares of common stock outstanding. The price of its stock on January 31, 2018, was $113.91. All questions relate to the fiscal year ended January 31, 2019, unless stated otherwise.
Notes to Consolidated Financial Statements
1. Summary of Business and Significant Accounting Policies Description of Business Salesforce.com, inc. (the "Company") is a leading provider of enterprise software, delivered through the cloud, with a focus on customer relationship management, or CRM. The Company introduced its first CRM solution in 2000, and has since expanded its service offerings into new areas and industries with new editions, features and platform capabilities. Stock-Based Expense The Company recognizes stock-based expenses related to stock options and restricted stock awards on a straight-line basis, net of estimated forfeitures, over the requisite service period of the awards, which is generally the vesting term of four years.
10. Stockholders' Equity The Company maintains the following stock plans: the ESPP, the 2013 Equity Incentive Plan and the 2014 InducemenEquity Incentive Plan ("2014 Inducement Plan"). As of January 31, 2019 and January 31, 2018, $76 million and $63 million, respectively, was withheld on behalf of employees for future purchases under the ESPP and is recorded in accrued compensation. From February 1, 2006 through July 2013, options issued had a term of five years. After July 2013, options issued have a term of seven years.
The fair value of each stock option grant was estimated on the date of grant using the Black-Scholes option pricing model with the following assumptions and fair value per share:
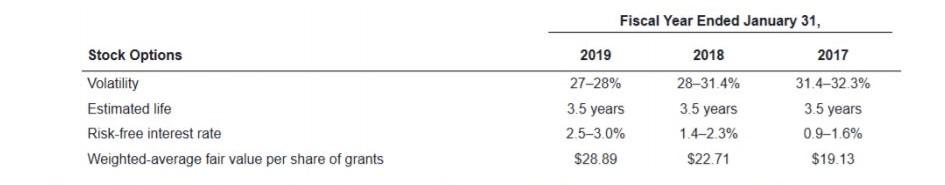
The Company estimated its future stock price volatility considering both its observed option-implied volatilities and its historical volatility calculations. Management believes this is the best estimate of the expected volatility over the expected life of its stock options and stock purchase rights.
The estimated life for the stock options was based on an analysis of historical exercise activity. The risk-free interest rate is based on the rate for a U.S. government security with the same estimated life at the time of the option grant and the stock purchase rights.
The estimated forfeiture rate applied is based on historical forfeiture rates. The Company does not anticipate paying any cash dividends in the foreseeable future and therefore uses an expected dividend yield of zero in the option pricing model.
Stock activity excluding the ESPP is as follows:
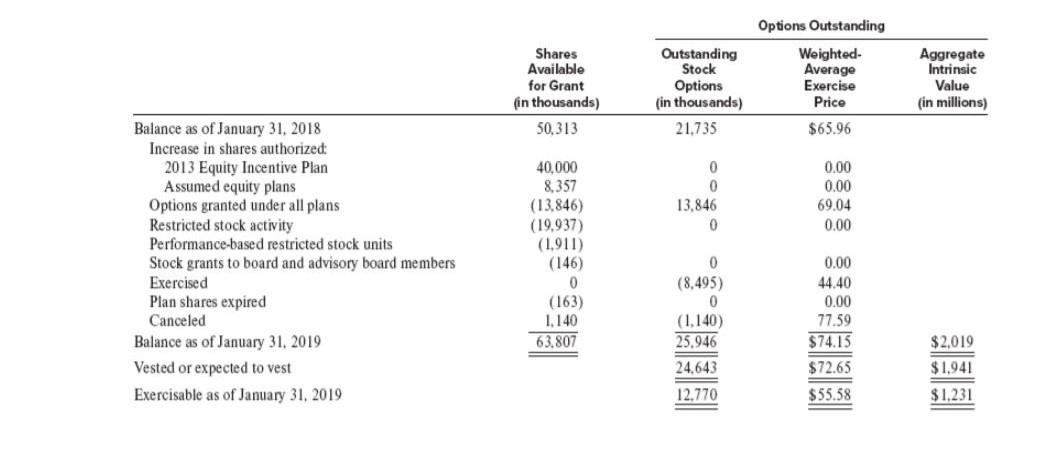
The total intrinsic value of the options exercised during fiscal 2019, 2018 and 2017 was $784 million, $373 million and $224 million, respectively.
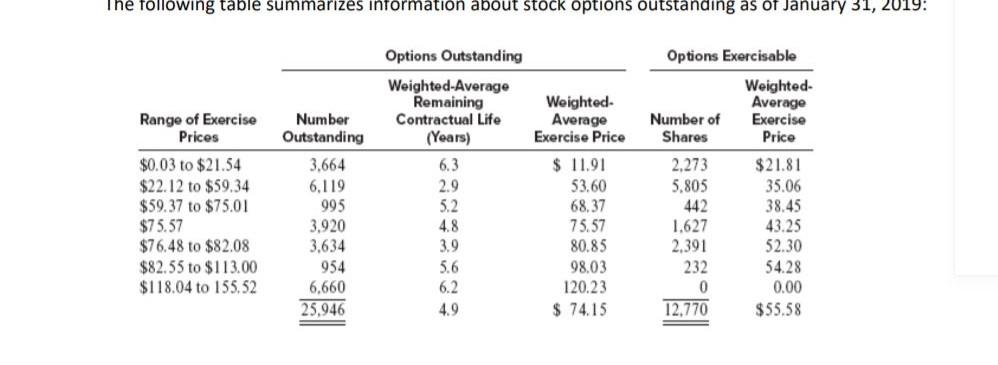
The intrinsic value is the difference between the current market value of the stock and the exercise price of the stock option. The weighted-average remaining contractual life of vested and expected to vest options is approximately 5 years.
As of January 31, 2019, options to purchase 12.8 million shares were vested at a weighted average exercise price of $55.58 per share and had a remaining weighted-average contractual life of approximately 4 years. The total intrinsic value of these vested options as of January 31, 2019, was $1.2 billion.
During fiscal 2019, the Company recognized stock-based expense related to it equity plans for employees and non-employee directors of $1.3 billion. As of January 31, 2019, the aggregate stock compensation remaining to be amortized to costs and expenses was approximately $2.5 billion. The Company will amortize this stock compensation balance as follows: $1.2 billion during fiscal 2020; $0.8 billion during fiscal 2021; $453 million during fiscal 2022; $108 million during fiscal 2023 and $8 million during fiscal 2024. The expected amortization reflects only outstanding stock awards as of January 31, 2019 and assumes no forfeiture activity.
The aggregate stock compensation remaining to be amortized to costs and expenses will be recognized over a weighted average period of 2 years.
The following table summarizes information about stock options outstanding as of January 31, 2019:
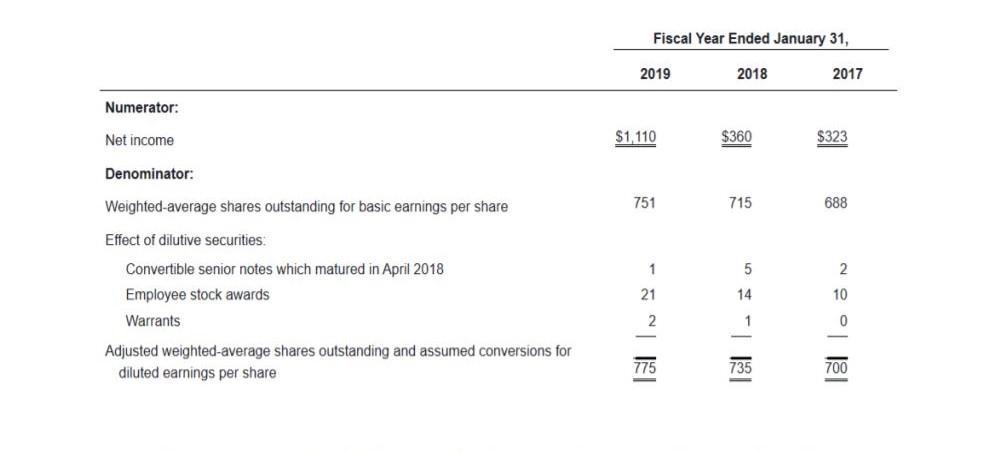
12. Earnings Per Share Basic earnings per share is computed by dividing net income by the weighted-average number of common shares outstanding for the fiscal period. Diluted earnings per share is computed by giving effect to all potential weighted average dilutive common stock, including options, restricted stock units, warrants and the convertible senior notes. The dilutive effect of outstanding awards and convertible securities is reflected in diluted earnings per share by application of the treasury stock method.
A reconciliation of the denominator used in the calculation of basic and diluted earnings per share is as follows (in millions):
The weighted-average number of shares outstanding used in the computation of diluted earnings per share does not include the effect of the following potential outstanding common stock. The effects of these potentially outstanding shares were not included in the calculation of diluted earnings/loss per share because the effect would have been anti-dilutive (in millions):

Required calculations must be done in excel and summarize each questions:
4, Assume that all of the options exercised in 2019 are treated as nonqualified options for tax purposes. Compute the tax benefit that salesforce.com received from the option exercise. Label your calculations and explain.
5, Refer to Note 12. Explain how stock awards affected the numerators and denominators in both basic and diluted EPS.
6, Refer to Note 12. Explain why the dilutive effects of some securities were not included in the calculation of diluted EPS.
Show transcribed image text
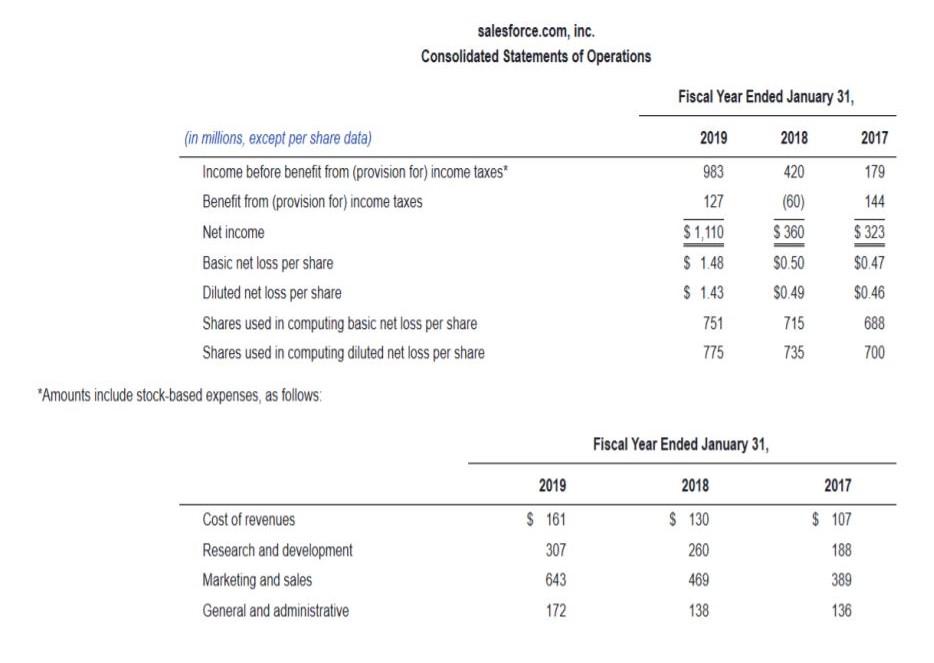
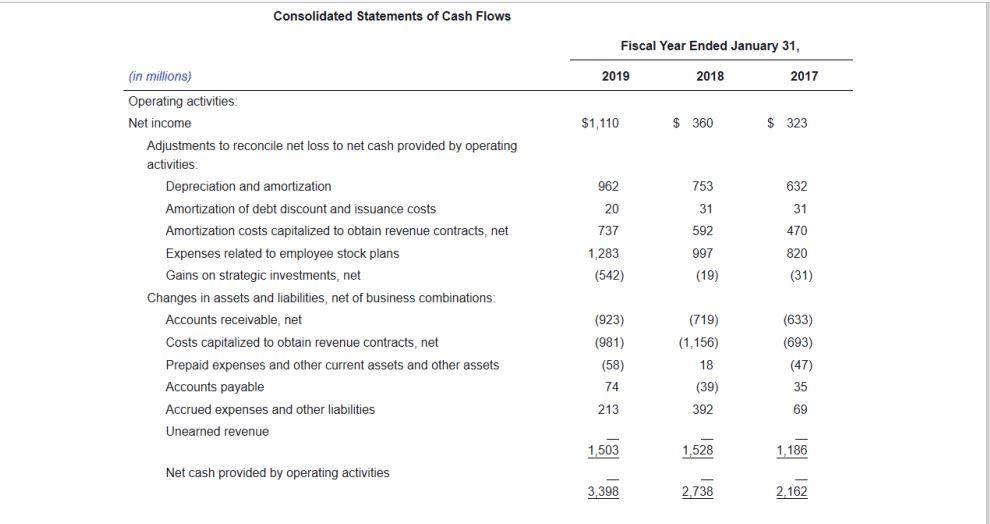
salesforce.com, inc. Consolidated Statements of Operations Fiscal Year Ended January 31, 2019 2017 983 179 144 $323 (in Millions, except per share data) Income before benefit from (provision for) income taxes* Benefit from (provision for) income taxes Net income Basic net loss per share Diluted net loss per share Shares used in computing basic net loss per share Shares used in computing diluted net loss per share 2018 420 (60) S 360 $0.50 $0.49 715 735 127 $ 1,110 $ 1.48 $ 1.43 751 775 $0.47 $0.46 688 700 *Amounts include stock-based expenses, as follows: Fiscal Year Ended January 31, 2019 2018 2017 Cost of revenues Research and development Marketing and sales General and administrative $ 161 307 643 172 $ 130 260 469 138 $ 107 188 389 136 Consolidated Statements of Cash Flows Fiscal Year Ended January 31, 2019 2018 2017 $1,110 $ 360 $ 323 962 753 632 20 31 31 592 737 470 (in millions) Operating activities Net income Adjustments to reconcile net loss to net cash provided by operating activities Depreciation and amortization Amortization of debt discount and issuance costs Amortization costs capitalized to obtain revenue contracts, net Expenses related to employee stock plans Gains on strategic investments, net Changes in assets and liabilities, net of business combinations Accounts receivable, net Costs capitalized to obtain revenue contracts, net Prepaid expenses and other current assets and other assets Accounts payable Accrued expenses and other liabilities Unearned revenue 997 1,283 (542) 820 (31) (19) (633) (923) (981) (719) (1,156) 18 (39) 392 (693) (47) (58) 74 213 35 69 1,503 1,528 1,186 Net cash provided by operating activities 3,398 2.738 2.162 Stock Options Volatility Estimated life Risk-free interest rate Weighted average fair value per share of grants Fiscal Year Ended January 31, 2019 2018 2017 27-28% 2831.4% 31.432.3% 3.5 years 3.5 years 3.5 years 2.5-3.0% 1.4-2.3% 0.9-1.6% $28.89 $22.71 $19.13 Shares Available for Grant fin thousands) 50,313 Outstanding Stock Options (in thousands) 21.735 Options Outstanding Weighted Average Exercise Price Aggregate Intrinsic Value (in millions) $65.96 0 0 13,846 0 0.00 0.00 69,04 0.00 Balance as of January 31, 2018 Increase in shares authorized: 2013 Equity Incentive Plan Assumed equity plans Options granted under all plans Restricted stock activity Performance-based restricted stock units Stock grants to board and advisory board members Exercised Plan shares expired Canceled Balance as of January 31, 2019 Vested or expected to vest Exercisable as of January 31, 2019 40.000 8,357 (13.846) (19,937) (1.911) (146) 0 (163) 1.140 63.807 0 (8,495) 0 (1.140) 25.946 24.643 12.770 0.00 44.40 0.00 77.59 $74.15 $72.65 $55.58 $2,019 $1.941 $1.231 The following table summarizes information about stock options outstanding as of January 31, 2019: Options Exercisable Weighted Average Exercise Price Range of Exercise Prices $0.03 to $21.54 $22.12 to $59.34 $59.37 to $75.01 $75.57 $76.48 to $82.08 $82.55 to $113.00 $118.04 to 155.52 Number Outstanding 3,664 6,119 995 3.920 3,634 954 6,660 25.946 Options Outstanding Weighted-Average Remaining Contractual Life (Years) 6.3 2.9 5.2 4.8 3.9 5.6 6.2 4.9 Weighted Average Exercise Price $ 11.91 53.60 68,37 75.57 80.85 98.03 120.23 $ 74.15 Number of Shares 2.273 5.805 442 1.627 2.391 232 0 12.770 $21.81 35.06 38.45 43.25 52.30 54.28 0.00 $55.58 Fiscal Year Ended January 31, 2019 2018 2017 Numerator: Net income $1,110 $360 $323 Denominator: Weighted average shares outstanding for basic earnings per share 751 715 688 Effect of dilutive securities 1 5 2 Convertible senior notes which matured in April 2018 Employee stock awards Warrants 21 14 10 2 1 0 Adjusted weighted average shares outstanding and assumed conversions for diluted earnings per share 775 735 700 Fiscal Year Ended January 31, 2019 2018 2017 4 11 Employee stock awards Warrants 7 0 0 17 salesforce.com, inc. Consolidated Statements of Operations Fiscal Year Ended January 31, 2019 2017 983 179 144 $323 (in Millions, except per share data) Income before benefit from (provision for) income taxes* Benefit from (provision for) income taxes Net income Basic net loss per share Diluted net loss per share Shares used in computing basic net loss per share Shares used in computing diluted net loss per share 2018 420 (60) S 360 $0.50 $0.49 715 735 127 $ 1,110 $ 1.48 $ 1.43 751 775 $0.47 $0.46 688 700 *Amounts include stock-based expenses, as follows: Fiscal Year Ended January 31, 2019 2018 2017 Cost of revenues Research and development Marketing and sales General and administrative $ 161 307 643 172 $ 130 260 469 138 $ 107 188 389 136 Consolidated Statements of Cash Flows Fiscal Year Ended January 31, 2019 2018 2017 $1,110 $ 360 $ 323 962 753 632 20 31 31 592 737 470 (in millions) Operating activities Net income Adjustments to reconcile net loss to net cash provided by operating activities Depreciation and amortization Amortization of debt discount and issuance costs Amortization costs capitalized to obtain revenue contracts, net Expenses related to employee stock plans Gains on strategic investments, net Changes in assets and liabilities, net of business combinations Accounts receivable, net Costs capitalized to obtain revenue contracts, net Prepaid expenses and other current assets and other assets Accounts payable Accrued expenses and other liabilities Unearned revenue 997 1,283 (542) 820 (31) (19) (633) (923) (981) (719) (1,156) 18 (39) 392 (693) (47) (58) 74 213 35 69 1,503 1,528 1,186 Net cash provided by operating activities 3,398 2.738 2.162 Stock Options Volatility Estimated life Risk-free interest rate Weighted average fair value per share of grants Fiscal Year Ended January 31, 2019 2018 2017 27-28% 2831.4% 31.432.3% 3.5 years 3.5 years 3.5 years 2.5-3.0% 1.4-2.3% 0.9-1.6% $28.89 $22.71 $19.13 Shares Available for Grant fin thousands) 50,313 Outstanding Stock Options (in thousands) 21.735 Options Outstanding Weighted Average Exercise Price Aggregate Intrinsic Value (in millions) $65.96 0 0 13,846 0 0.00 0.00 69,04 0.00 Balance as of January 31, 2018 Increase in shares authorized: 2013 Equity Incentive Plan Assumed equity plans Options granted under all plans Restricted stock activity Performance-based restricted stock units Stock grants to board and advisory board members Exercised Plan shares expired Canceled Balance as of January 31, 2019 Vested or expected to vest Exercisable as of January 31, 2019 40.000 8,357 (13.846) (19,937) (1.911) (146) 0 (163) 1.140 63.807 0 (8,495) 0 (1.140) 25.946 24.643 12.770 0.00 44.40 0.00 77.59 $74.15 $72.65 $55.58 $2,019 $1.941 $1.231 The following table summarizes information about stock options outstanding as of January 31, 2019: Options Exercisable Weighted Average Exercise Price Range of Exercise Prices $0.03 to $21.54 $22.12 to $59.34 $59.37 to $75.01 $75.57 $76.48 to $82.08 $82.55 to $113.00 $118.04 to 155.52 Number Outstanding 3,664 6,119 995 3.920 3,634 954 6,660 25.946 Options Outstanding Weighted-Average Remaining Contractual Life (Years) 6.3 2.9 5.2 4.8 3.9 5.6 6.2 4.9 Weighted Average Exercise Price $ 11.91 53.60 68,37 75.57 80.85 98.03 120.23 $ 74.15 Number of Shares 2.273 5.805 442 1.627 2.391 232 0 12.770 $21.81 35.06 38.45 43.25 52.30 54.28 0.00 $55.58 Fiscal Year Ended January 31, 2019 2018 2017 Numerator: Net income $1,110 $360 $323 Denominator: Weighted average shares outstanding for basic earnings per share 751 715 688 Effect of dilutive securities 1 5 2 Convertible senior notes which matured in April 2018 Employee stock awards Warrants 21 14 10 2 1 0 Adjusted weighted average shares outstanding and assumed conversions for diluted earnings per share 775 735 700 Fiscal Year Ended January 31, 2019 2018 2017 4 11 Employee stock awards Warrants 7 0 0 17
Step by Step Solution
There are 3 Steps involved in it

Get step-by-step solutions from verified subject matter experts