

Question: Refer to the stock you selected in Module 1. Using the same downloaded data, build a 95 percent confidence interval for the daily stock volume
Refer to the stock you selected in Module 1. Using the same downloaded data, build a 95 percent confidence interval for the daily stock volume using your downloaded data. What does this confidence interval mean?
Why might dedecision-makerse interested in such an interval?
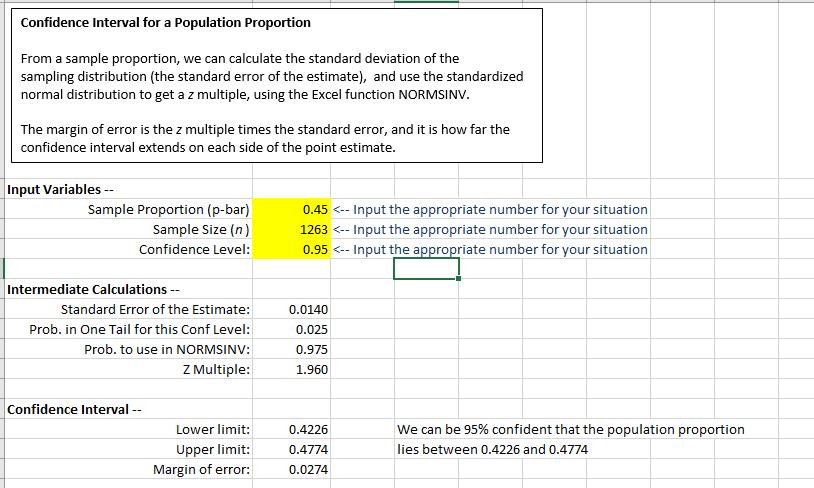
Confidence Interval for a Population Proportion From a sample proportion, we can calculate the standard deviation of the sampling distribution (the standard error of the estimate), and use the standardized normal distribution to get a z multiple, using the Excel function NORMSINV. The margin of error is the z multiple times the standard error, and it is how far the confidence interval extends on each side of the point estimate. Input Variables -- Sample Proportion (p-bar) 0.45
Step by Step Solution
3.41 Rating (151 Votes )
There are 3 Steps involved in it
General motors data from 30082013 to 30082018 The summary of this data is n 1260 Mean 1493073246 Std... View full answer

Get step-by-step solutions from verified subject matter experts