

Question: Refer to the table Factors for Computing _ Control Chart Limits ( 3 sigma ) . for this problem. The overall average of a process
Refer to the table Factors for ComputingControl Chart Limits sigma for this problem.
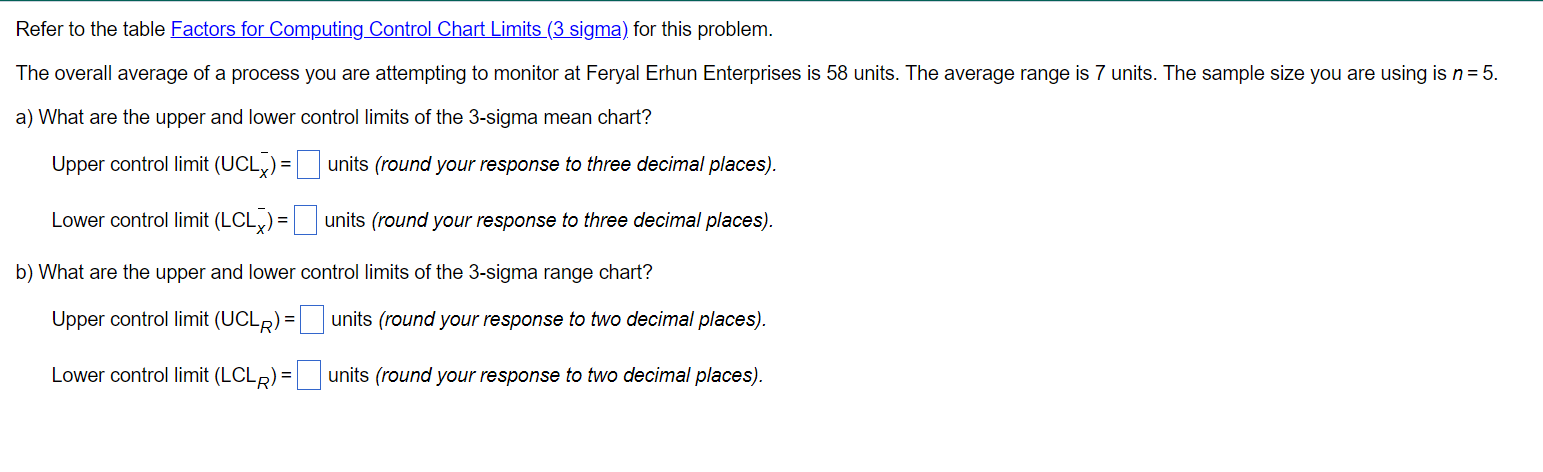
The overall average of a process you are attempting to monitor at Feryal Erhun Enterprises is units. The average range is units. The sample size you are using is
a What are the upper and lower control limits of the sigma mean chart?
Upper control limit units round your response to three decimal places
Lower control limit units round your response to three decimal places
b What are the upper and lower control limits of the sigma range chart?
Upper control limit units round your response to two decimal places
Lower control limit units round your response to two decimal places
Step by Step Solution
There are 3 Steps involved in it
1 Expert Approved Answer
Step: 1 Unlock

Question Has Been Solved by an Expert!
Get step-by-step solutions from verified subject matter experts
Step: 2 Unlock
Step: 3 Unlock