

Question: Refer to the table Factors for Computing Control Chart Limits. 3 sigms) for this problem. Pet Products, Inc, caters to the growing market for cat
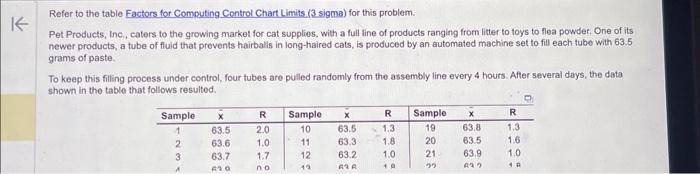
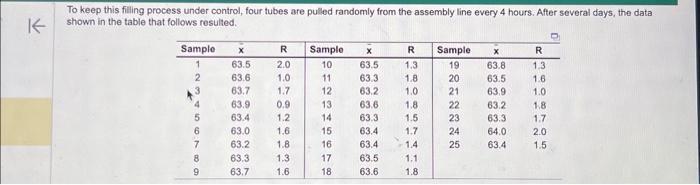
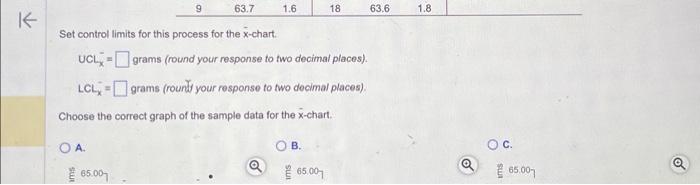
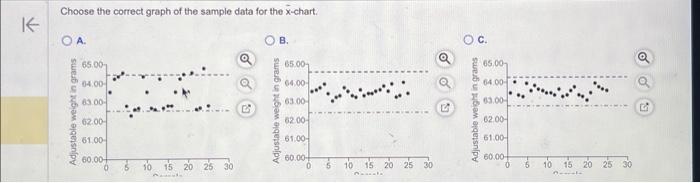
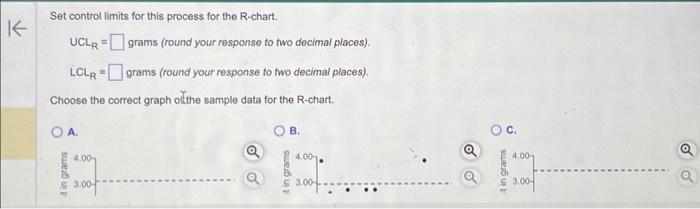
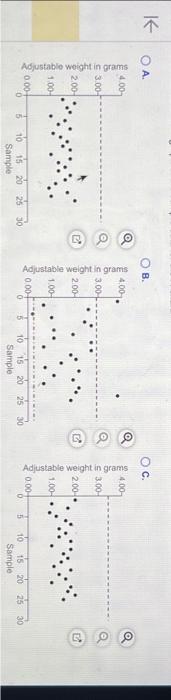
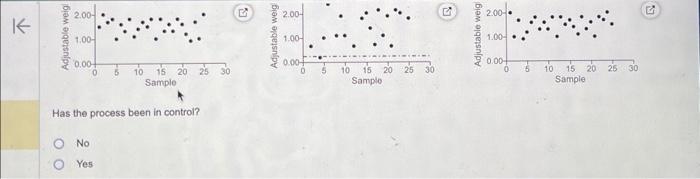
Refer to the table Factors for Computing Control Chart Limits. 3 sigms) for this problem. Pet Products, Inc, caters to the growing market for cat supplies, with a full line of products ranging from litter to toys to flea powdet. One of its newer products, a tube of fluid that prevents hairballs in long-haired cats, is produced by an automated machine set to fill each tube with 63.5 grams of paste. To keep this filling process under control, four tubes are pulled randomly from the assembly line every 4 hours. After several days, the data shown in the table that follows resulted. To keep this filling process under control, four tubes are pulled randomly from the assembly line every 4 hours: After several days, the data shown in the table that follows resulted. Set control limits for this process for the x-chart. UCLx=grams (round your response to two decimal places). LCLx=grams (round your response to two docimal places). Choose the correct graph of the sample data for the x-chart. A. B. 65.007 Q E 65.007 Choose the correct graph of the sample data for the x-chart. A. B. Set control limits for this process for the R-chart. UCLR=grams(roundyourresponsetotwodecimalplaces).LCLR=grams(roundyourresponsetotwodecimalplaces). Choose the correct graph olthe sample data for the R-chart. K OA. B. c. Q Has the process been in control? No Yes
Step by Step Solution
There are 3 Steps involved in it

Get step-by-step solutions from verified subject matter experts