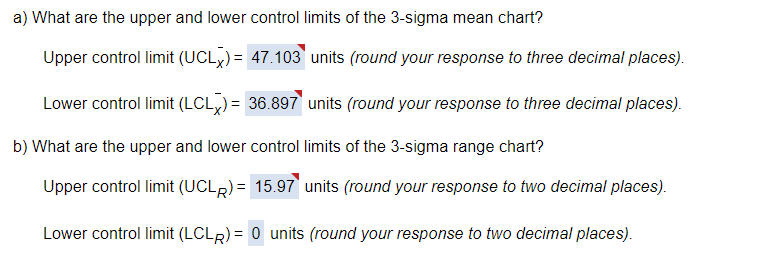
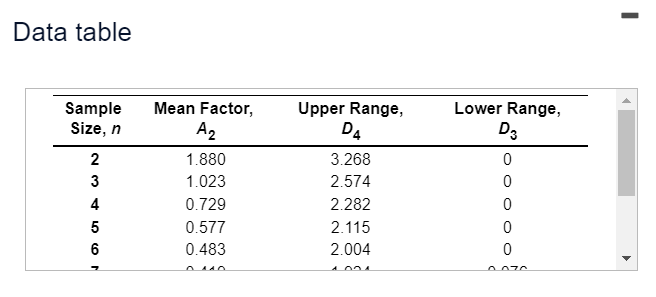
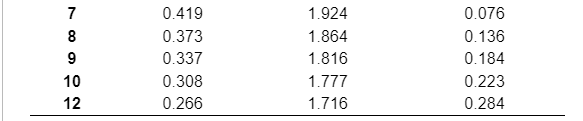
Question: Refer to the table Factors for Computing Control Chart Limits sigma) for this problem. The overall average of a process you are attempting to monitor

Refer to the table Factors for Computing ControlRefer to the table Factors for Computing ControlRefer to the table Factors for Computing ControlRefer to the table Factors for Computing Control

Refer to the table Factors for Computing Control Chart Limits sigma) for this problem. The overall average of a process you are attempting to monitor at Feryal Erhun Enterprises is 41 units. The average range is 7 units. The sample size you are using is n=4. a) What are the upper and lower control limits of the 3-sigma mean chart? a) What are the upper and lower control limits of the 3-sigma mean chart? Upper control limit (UCLX) = 47.103 units (round your response to three decimal places). Lower control limit (LCL,) = 36.897 units (round your response to three decimal places). b) What are the upper and lower control limits of the 3-sigma range chart? Upper control limit (UCLR) = 15.97 units (round your response to two decimal places). Lower control limit (LCLR) = 0 units (round your response to two decimal places). - Data table Sample Size, n 2 3 4 5 6 Mean Factor, A2 1.880 1.023 0.729 0.577 0.483 Upper Range, D4 3.268 2.574 2.282 2.115 2.004 Lower Range, D3 0 0 0 0 0 NO 7 8 9 10 12 0.419 0.373 0.337 0.308 0.266 1.924 1.864 1.816 1.777 1.716 0.076 0.136 0.184 0.223 0.284 NO

Step by Step Solution

There are 3 Steps involved in it

1 Expert Approved Answer
Step: 1 Unlock blur-text-image
Question Has Been Solved by an Expert!

Get step-by-step solutions from verified subject matter experts

Step: 2 Unlock
Step: 3 Unlock

Students Have Also Explored These Related General Management Questions!