

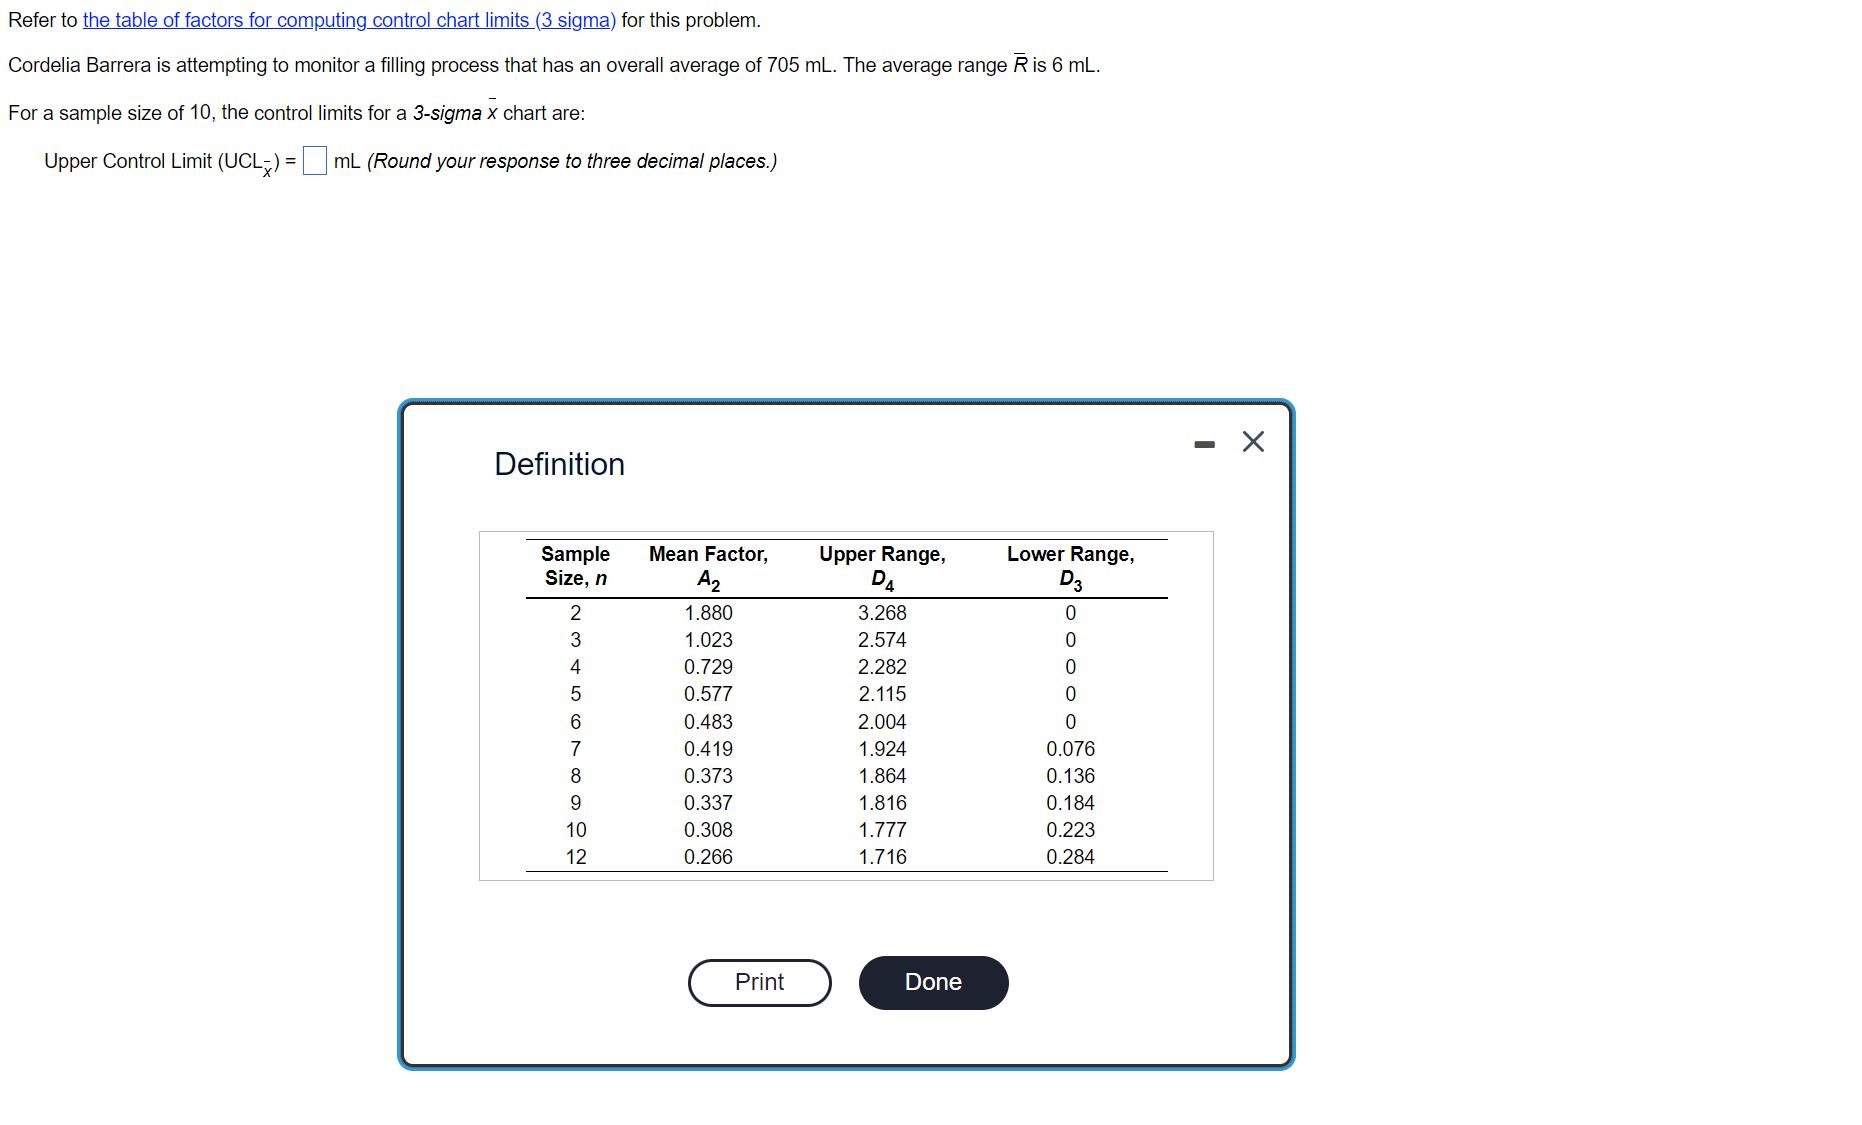
Question: Refer to the table of factors for computing control chart limits ( 3 sigma ) for this problem. Cordelia Barrera is attempting to monitor a
Refer to the table of factors for computing control chart limits sigma for this problem.
Cordelia Barrera is attempting to monitor a filling process that has an overall average of The average range is
For a sample size of the control limits for a sigma chart are:
Upper Control Limit Round your response to three decimal places.
Definition
Step by Step Solution
There are 3 Steps involved in it
1 Expert Approved Answer
Step: 1 Unlock

Question Has Been Solved by an Expert!
Get step-by-step solutions from verified subject matter experts
Step: 2 Unlock
Step: 3 Unlock