

Question: Reference: https://phet.colorado.edu/en/simulations/wave-interference Single Silt Diffraction, on the right, click on One silt (drop down), then Screen and Intensity. The simulation is doing what the lecture
Reference: https://phet.colorado.edu/en/simulations/wave-interference
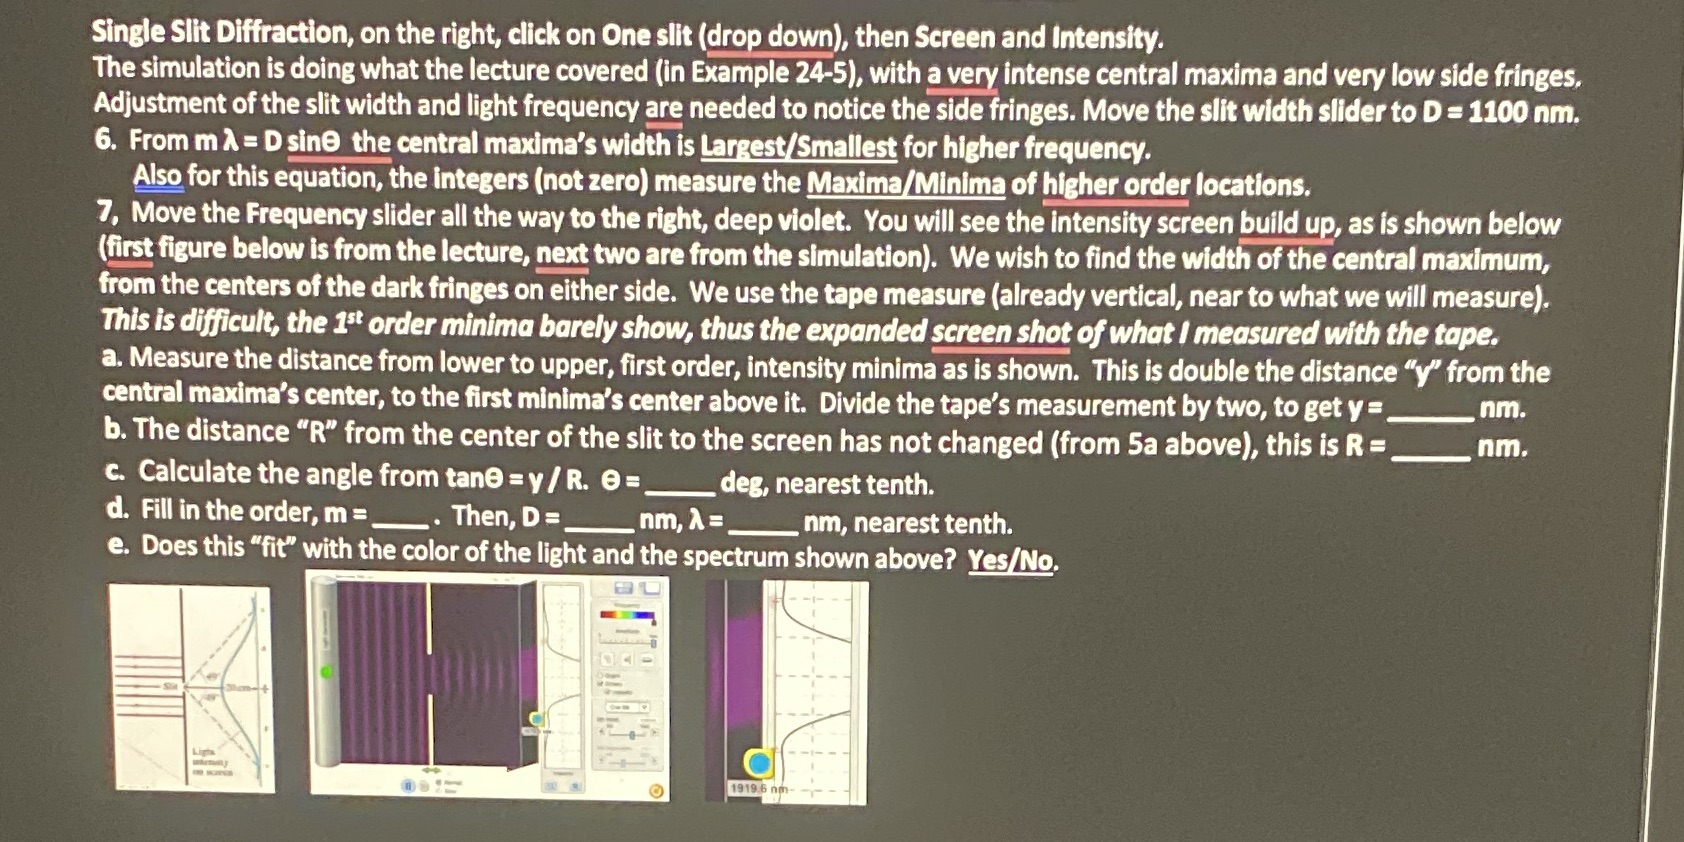
Single Silt Diffraction, on the right, click on One silt (drop down), then Screen and Intensity. The simulation is doing what the lecture covered (in Example 24-5), with a very intense central maxima and very low side fringes. Adjustment of the slit width and light frequency are needed to notice the side fringes. Move the silt width slider to D = 1100 nm. 6. From m h = D sine the central maxima's width Is Larg[est$mallest for higher frequency. Also for this equation, the integers (not zero) measure the MaximalMlnlma of higher order locations. 7. Move the Frequency slider all the way to the right, deep violet. You will see the intensity screen build up, as is shown below (rst figure below is from the lecture, next two are from the simulation). We wish to nd the width of the central maximum, from the centers of the dark fringes on either side. We use the tape measure (already vertical, near to what we will measure). This is difcult, the 1\" order minima barely show, thus the expanded screen shot of what I measured with the tape. a. Measure the distance from lower to upper, rst order, intensity minima as is shown. This is double the distance "y\" from the central maxima's center, to the rst minima's center above it. Divide the tape's measurement by two, to get v = nm. nm. b. The distance \"R" from the center of the slit to the screen has not changed (from 53 above), this is R = c. Calculate the angle from tens = y] R. e = __ deg, nearest tenth. d. Fill in the order, m = . Then, D = nm, A = nrn, nearest tenth. e. Does this "t" with the color of the light and the spectrum shown above? YeslNa
Step by Step Solution
There are 3 Steps involved in it

Get step-by-step solutions from verified subject matter experts