

Question: reference-https://drive.google.com/file/d/1-BAfTkmBQjLfs6bMPglWCg8tez692f1m/view?usp=sharing Match the expression in A with those I B by writing the letter of your answer on the line before the word. A B
reference-https://drive.google.com/file/d/1-BAfTkmBQjLfs6bMPglWCg8tez692f1m/view?usp=sharing
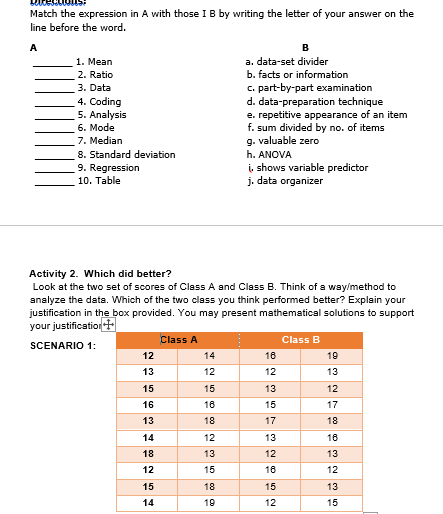
Match the expression in A with those I B by writing the letter of your answer on the line before the word. A B 1. Mean a, data-set divider Z. Ratio b. facts or information 3. Data c. part-by-part examination 4. Coding d. data-preparation technique 5. Analysis e. repetitive appearance of an item 6. Mode f. sum divided by no. of items 7. Median g. valuable zero 8. Standard deviation h. ANOVA 9. Regression i shows variable predictor 10. Table j. data organizer Activity 2. Which did better? Look at the two set of scores of Class A and Class B. Think of a way/method to analyze the data. Which of the two class you think performed better? Explain your justification in the box provided. You may present mathematical solutions to support your justification SCENARIO 1: Class A Class B 12 14 18 19 13 12 12 13 15 15 13 12 16 18 15 17 13 18 17 18 14 12 13 18 18 13 12 13 12 15 18 12 15 18 15 13 14 19 12 15V. Reflection: Can qualitative data be analyzed quantitatively? If so, explain how. Differentiate measures of central tendency from measures of variability. Do you agree that descriptive statistics can measure variable relationships? Why or why not
Step by Step Solution
There are 3 Steps involved in it

Get step-by-step solutions from verified subject matter experts