

Question: Referring to the graph, analyse the relationship between historical volatility and implied volatility. Hint: consider volatility cross-over, mean reversion, descriptive statistics etc. F 264 26/0
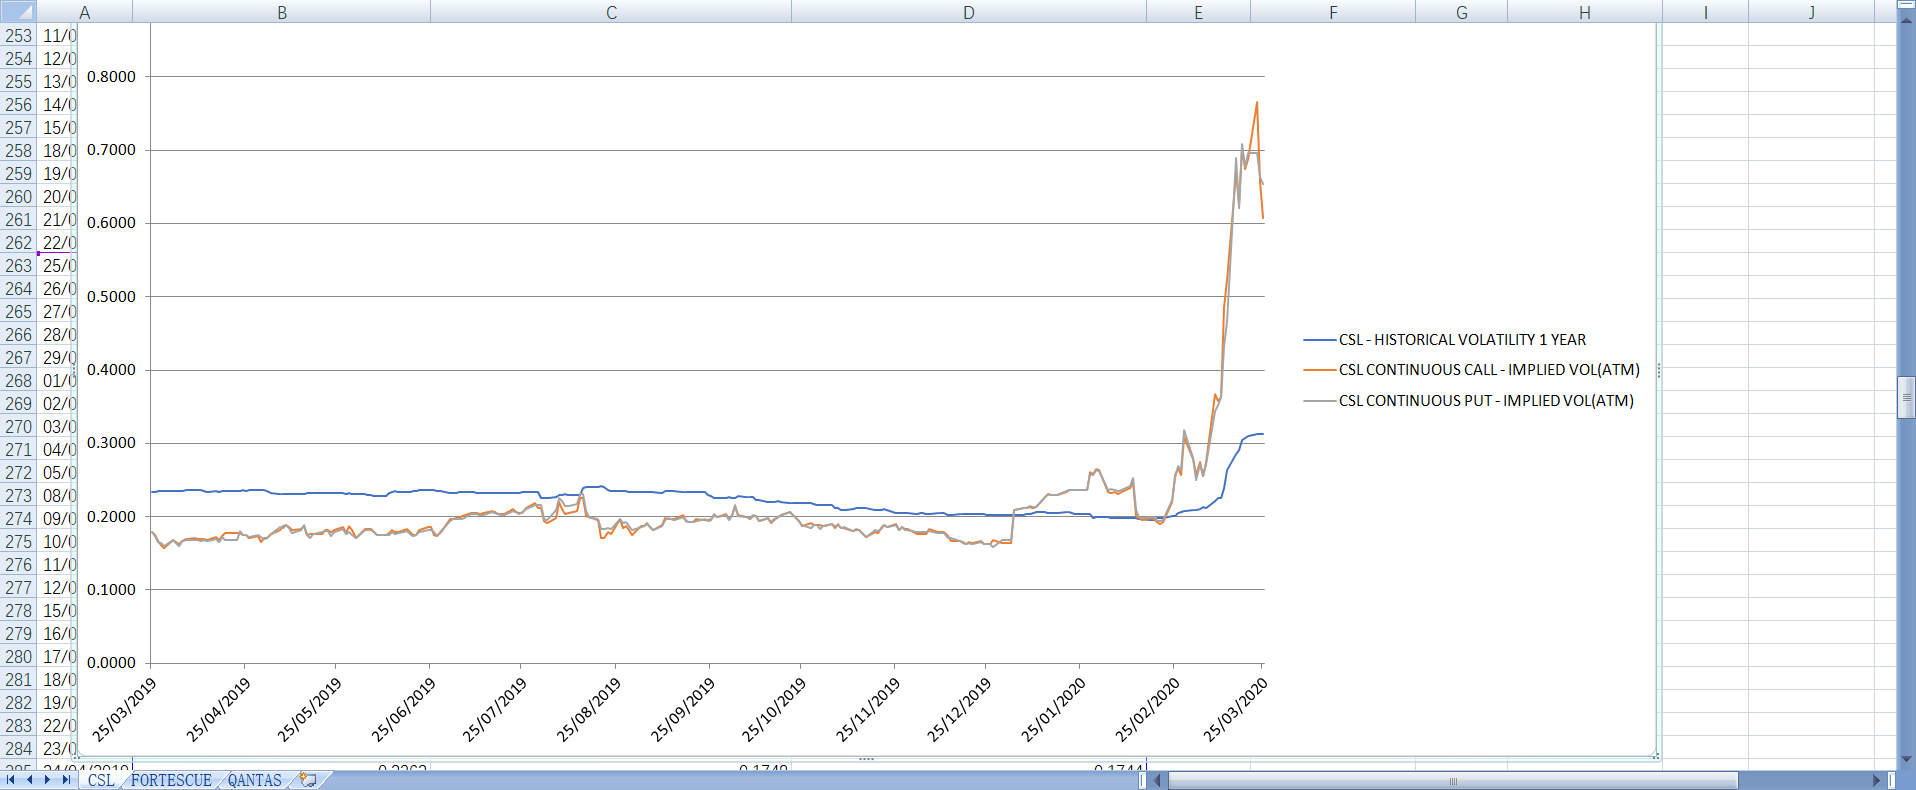
Referring to the graph, analyse the relationship between historical volatility and implied volatility. Hint: consider volatility cross-over, mean reversion, descriptive statistics etc.
F 264 26/0 253 11/0 254 12/0 255 13/0 0.8000 256 14/0 257 15/0 258 18/0 0.7000 259 19/0 260 20/0 261 21/0 0.6000 262 22/0 263 25/0 0.5000 265 27/0 266 28/0 267 29/0 268 01/0 0.4000 269 02/0 270 03/0 271 04/0 0.3000 272 05/0 273 08/0 274 09/0 0.2000 275 10/0 276 11/0 277 12/0 0.1000 278 15/0 279 16/0 CSL - HISTORICAL VOLATILITY 1 YEAR - CSL CONTINUOUS CALL - IMPLIED VOL(ATM) CSL CONTINUOUS PUT-IMPLIED VOL(ATM) woman 280 17/0 0.0000 281 18/0 282 19/0 283 22/0 284 23/0 mor10110010 KONCSL FORTESCUE QANTAS 25/06/2019 25/09/2019 25/10/2019 25/11/2019 25/03/2020 25/03/2019 25/04/2019 25/05/2019 25/07/2019 25/08/2019 25/12/2019 25/01/2020 25/02/2020 1710 1714
Step by Step Solution
There are 3 Steps involved in it

Get step-by-step solutions from verified subject matter experts