

Question: Refresh Your Math & Graphing Skills Consider the following graph, which shows the relationship between an individual's income and the number of times he or
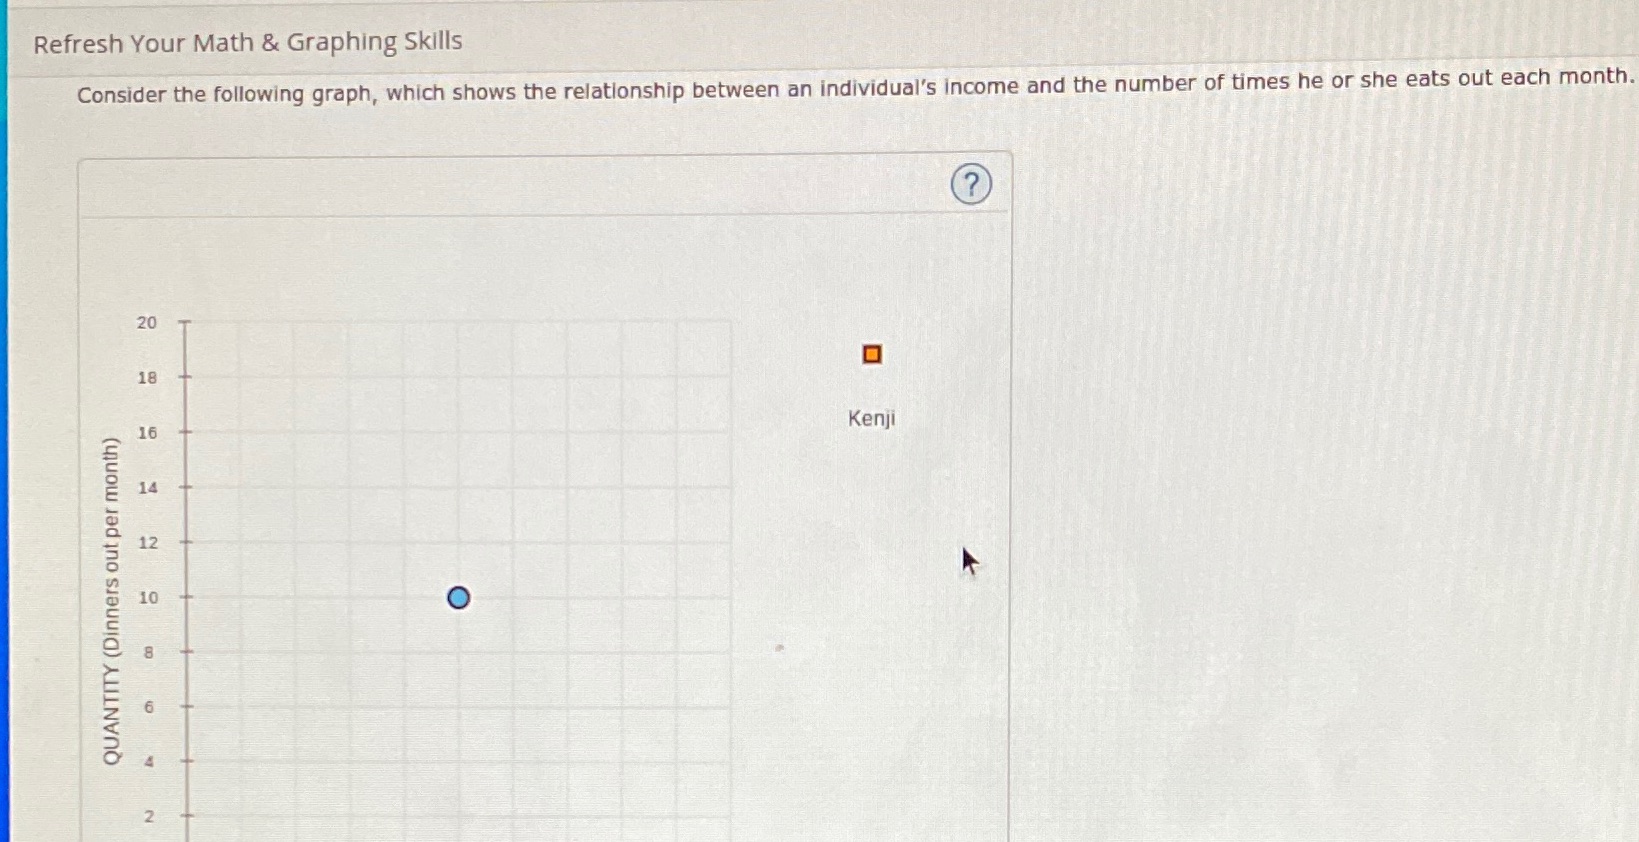
Refresh Your Math & Graphing Skills Consider the following graph, which shows the relationship between an individual's income and the number of times he or she eats out each month. 20 18 Kenji QUANTITY (Dinners out per month) 16 14 12 10 O CO 2
Step by Step Solution
There are 3 Steps involved in it
1 Expert Approved Answer
Step: 1 Unlock

Question Has Been Solved by an Expert!
Get step-by-step solutions from verified subject matter experts
Step: 2 Unlock
Step: 3 Unlock