

Question: regarding this document how do I find the weights using excel? and how is the rest solved using Excel? MONTHLY Expected Returns, Standard Deviations, and
regarding this document how do I find the weights using excel? and how is the rest solved using Excel?
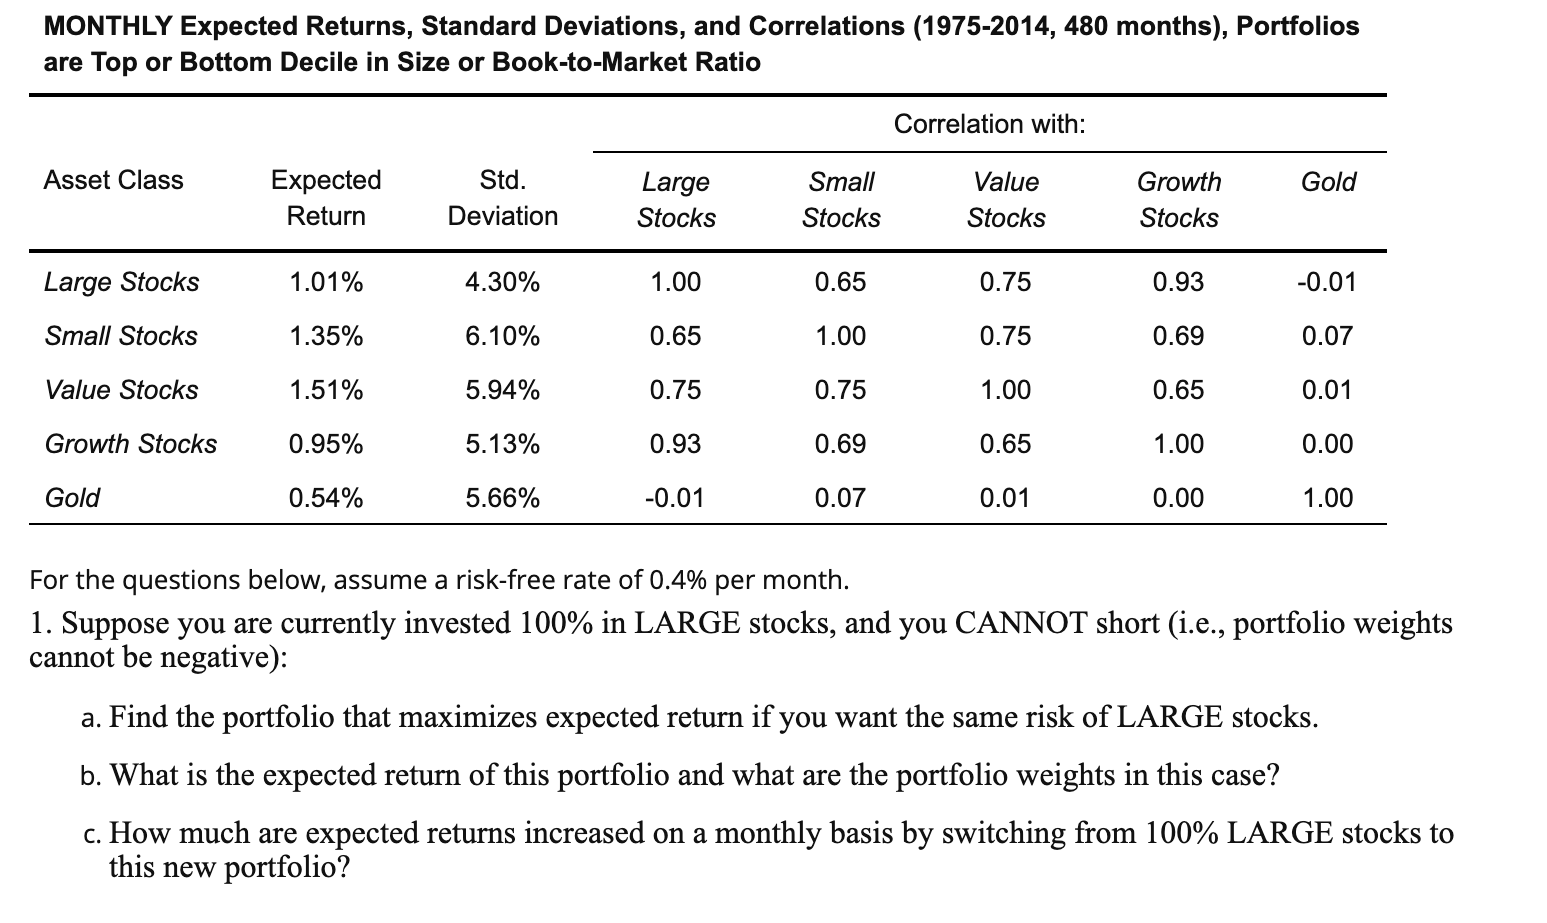
MONTHLY Expected Returns, Standard Deviations, and Correlations (1975-2014, 480 months), Portfolios are Top or Bottom Decile in Size or Book-to-Market Ratio Asset Class Large Stocks Small Stocks Value Stocks Growth Stocks Gold Expected Return 1.01% 1.35% 1.51% 0.95% 0.54% Std. Deviation 4.30% 6.10% 5.94% 5.13% 5.66% Large Stocks 1.00 0.65 0.75 0.93 -0.01 Small Stocks 0.65 1.00 0.75 0.69 0.07 Correlation with: Value Stocks 0.75 0.75 1.00 0.65 0.01 Growth Stocks 0.93 0.69 0.65 1.00 0.00 Gold -0.01 0.07 0.01 0.00 1.00 For the questions below, assume a risk-free rate of 0.4% per month. 1. Suppose you are currently invested 100% in LARGE stocks, and you CANNOT short (i.e., portfolio weights cannot be negative): a. Find the portfolio that maximizes expected return if you want the same risk of LARGE stocks. b. What is the expected return of this portfolio and what are the portfolio weights in this case? c. How much are expected returns increased on a monthly basis by switching from 100% LARGE stocks to this new portfolio?
Step by Step Solution
3.42 Rating (146 Votes )
There are 3 Steps involved in it

Get step-by-step solutions from verified subject matter experts