

Question: Registration times #1 Data Assignment 3: INTERPRETING DATA Submission date: 21 August 2024 @17h00 INSTRUCTIONS: What you need to submit: 1. Answer ALL questions in
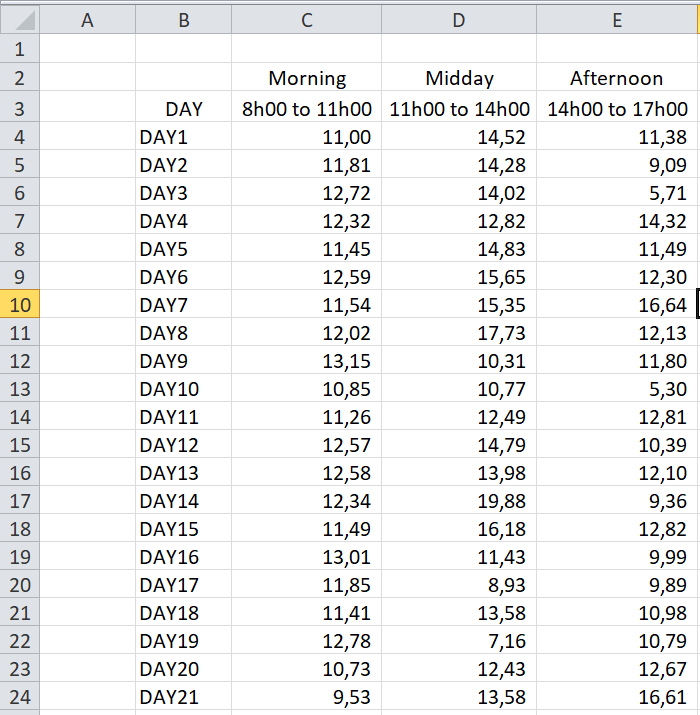
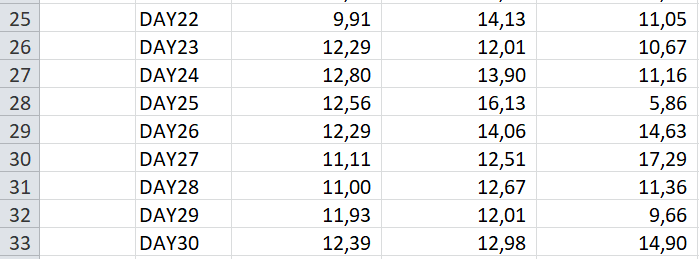
Registration times #1 Data
Step by Step Solution
There are 3 Steps involved in it
1 Expert Approved Answer
Step: 1 Unlock

Question Has Been Solved by an Expert!
Get step-by-step solutions from verified subject matter experts
Step: 2 Unlock
Step: 3 Unlock