

Question: Regression Practice Problem! Here is the scenario. You want to determine if there is a linear relationship between the number of hours of sleep students

Regression Practice Problem!
Here is the scenario. You want to determine if there is a linear relationship between the number of hours of sleep students got the night prior to an exam, and their score on the exam. There are two variables in the dataset, exam score (DV) and number of hours of sleep (IV). SPSS output pictures are attached below.
Looking in the output of SPSS please help me answer the following questions:
- What is the research question and hypothesis?
- What potential confounding variables can impact the relationship between the IV and DV.
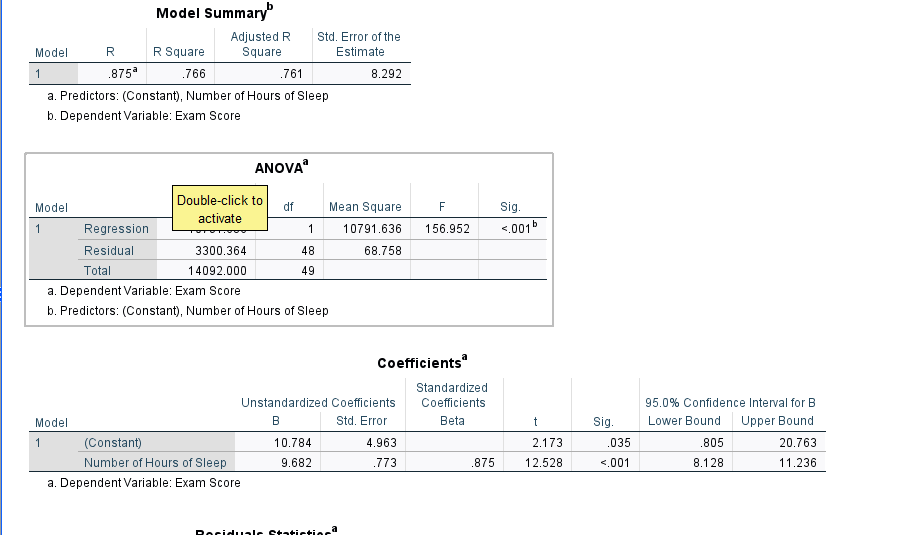
- Provide your regression equation based on the results of the full regression model.
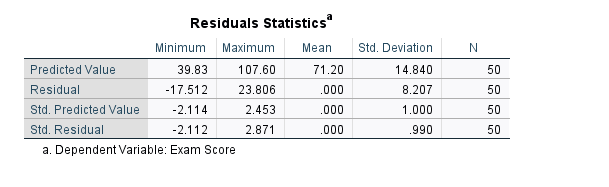
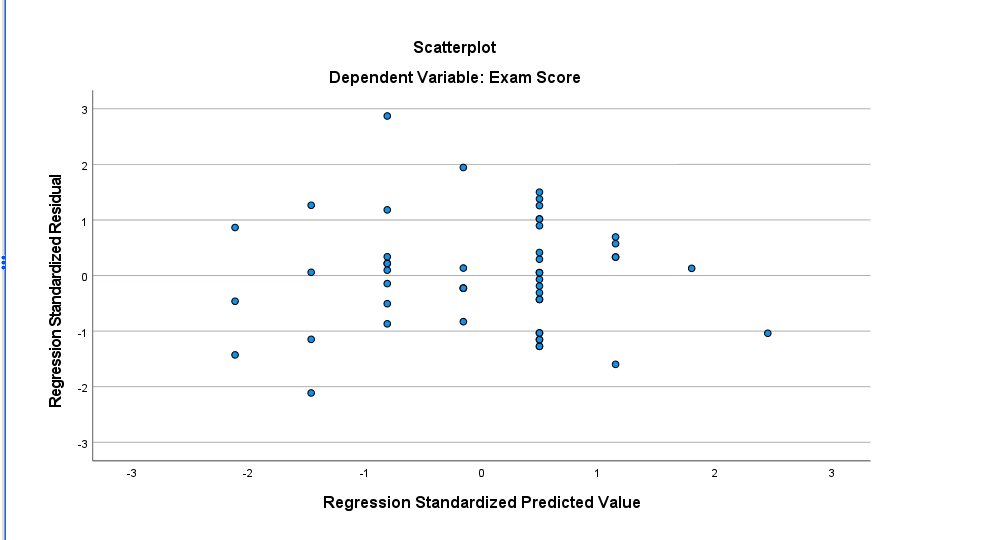
- What do the results tell us?
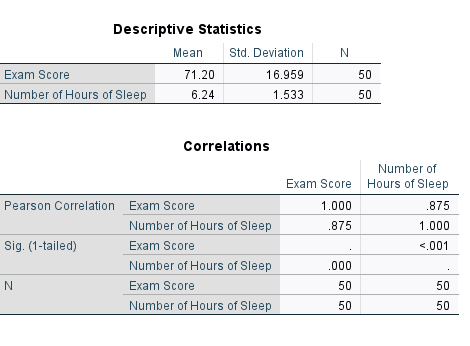

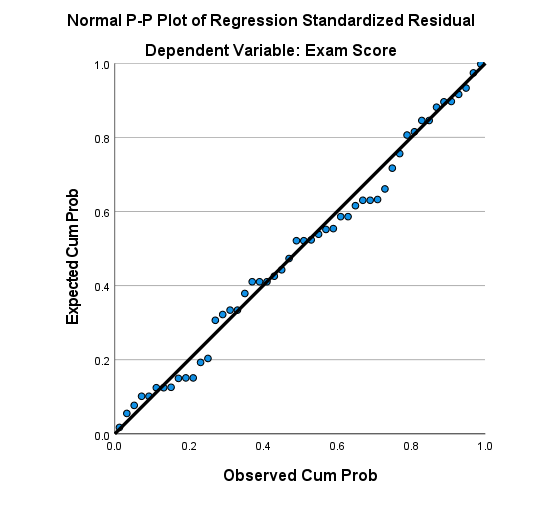

Descriptive Statistics Mean Std. Deviation N Exam Score 71.20 16.959 50 Number of Hours of Sleep 6.24 1.533 50 Correlations Number of Exam Score Hours of Sleep Pearson Correlation Exam Score 1.000 875 Number of Hours of Sleep 875 1.000 Sig. (1-tailed) Exam Score <.001 number of hours sleep n exam score summary adjusted r std. error the model square estimate .766 a. predictors: b. dependent variable: anova double-click to df mean f sig. activate regression residual total coefficients standardized unstandardized confidence interval for b beta lower bound upper .805 scoreresiduals statistics minimum maximum deviation predicted value scorenormal p-p plot expected cum prob observed probscatterplot . o>
Step by Step Solution
There are 3 Steps involved in it

Get step-by-step solutions from verified subject matter experts