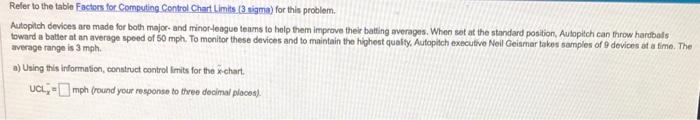
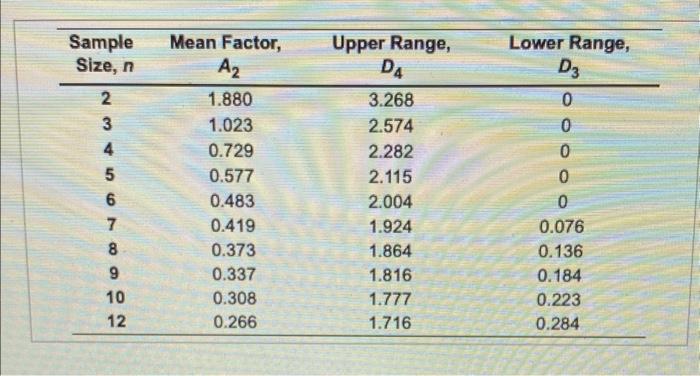
Question: Reler to the table Facters for Computing Control Chart Limits (3 s wigma) for this problem. Autopitch devices aro made for both major- and minortengue

Reler to the table Facters for Computing Control
Reler to the table Facters for Computing Control Chart Limits (3 s wigma) for this problem. Autopitch devices aro made for both major- and minortengue teams to holp them improve their batting mverages. Whan sot at the standard position, Autopitch can throw hartbols toward a batter at an average speed of 50 mph. To monitor these devices and to maintain the highest quality. Autopilich exbcutivo Neil Geismar takes samples of 9 devices af a fime. The average range is 3 mph. a) Using this irformation, construct control imits for the x-chart. UCL x= mph (round your response to three decimal places). \begin{tabular}{cccc} \hline Sample Size, n & Mean Factor, & Upper Range, D2 & Lower Range, D3 \\ \hline 2 & 1.880 & 3.268 & 0 \\ 3 & 1.023 & 2.574 & 0 \\ 4 & 0.729 & 2.282 & 0 \\ 5 & 0.577 & 2.115 & 0 \\ 6 & 0.483 & 2.004 & 0 \\ 7 & 0.419 & 1.924 & 0.076 \\ 8 & 0.373 & 1.864 & 0.136 \\ 9 & 0.337 & 1.816 & 0.184 \\ 10 & 0.308 & 1.777 & 0.223 \\ 12 & 0.266 & 1.716 & 0.284 \\ \hline \end{tabular}

Step by Step Solution

There are 3 Steps involved in it

1 Expert Approved Answer
Step: 1 Unlock blur-text-image
Question Has Been Solved by an Expert!

Get step-by-step solutions from verified subject matter experts

Step: 2 Unlock
Step: 3 Unlock

Students Have Also Explored These Related General Management Questions!