

Question: Construct control limits for the x chart Construct control limits for the R chart Will upvote right away for fully completed problem Refer to the
Construct control limits for the x chart
Construct control limits for the R chart
Will upvote right away for fully completed problem
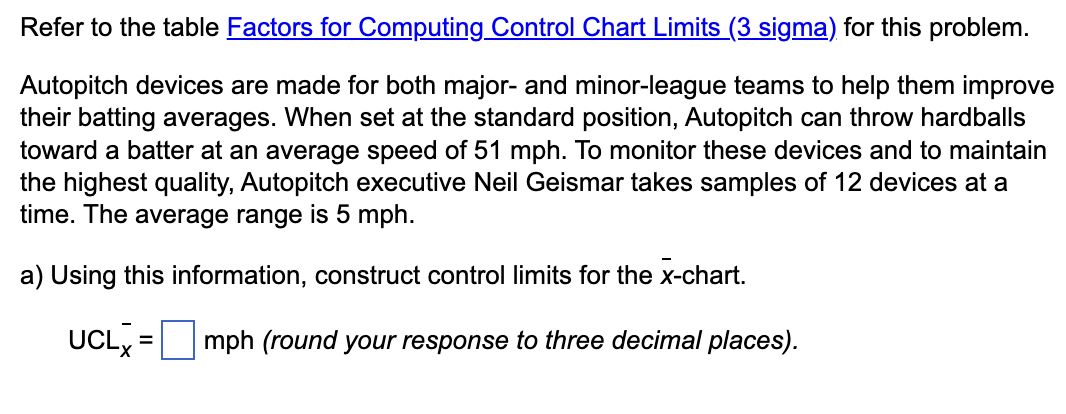
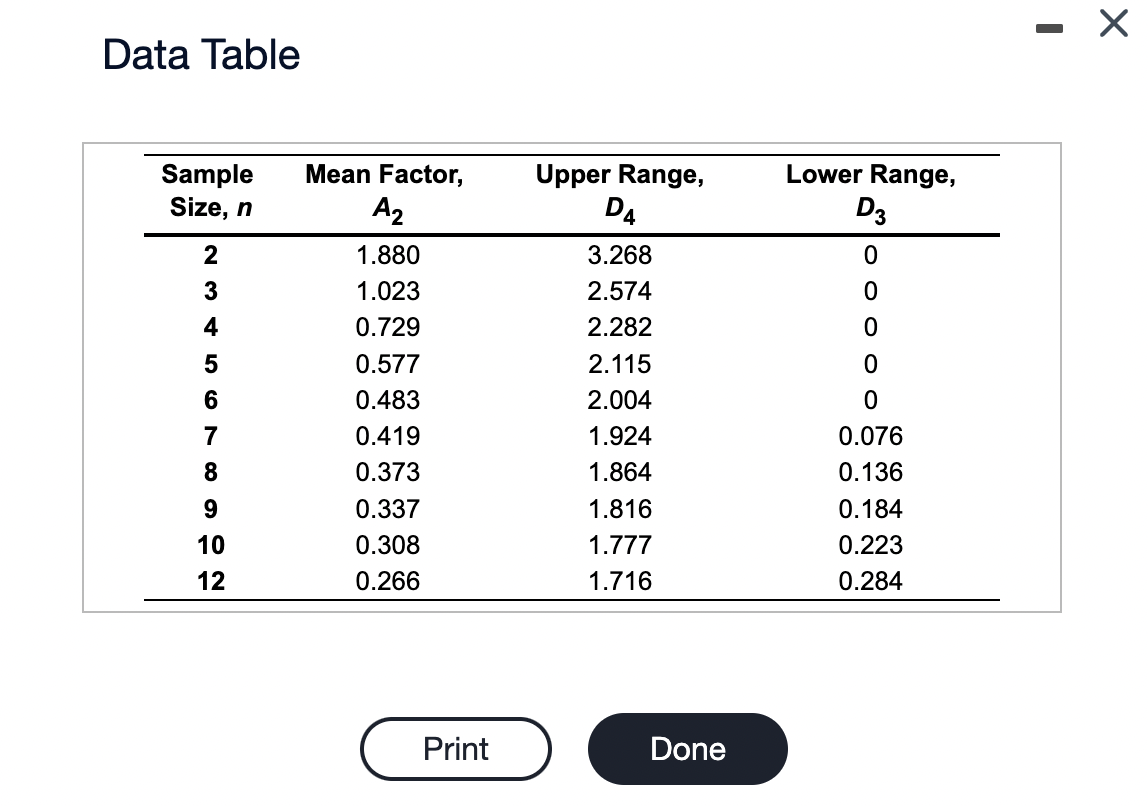
Refer to the table Factors for Computing Control Chart Limits (3 sigma) for this problem. Autopitch devices are made for both major- and minor-league teams to help them improve their batting averages. When set at the standard position, Autopitch can throw hardballs toward a batter at an average speed of 51mph. To monitor these devices and to maintain the highest quality, Autopitch executive Neil Geismar takes samples of 12 devices at a time. The average range is 5mph. a) Using this information, construct control limits for the x-chart. UCLx=mph (round your response to three decimal places). Data Table
Step by Step Solution
There are 3 Steps involved in it

Get step-by-step solutions from verified subject matter experts