

Question: Remaining Time: 1 h 2 minutes, 20 seconds. Question Completion Status: Figure 30-3 On the following graph, MS represents the money supply and MD represents
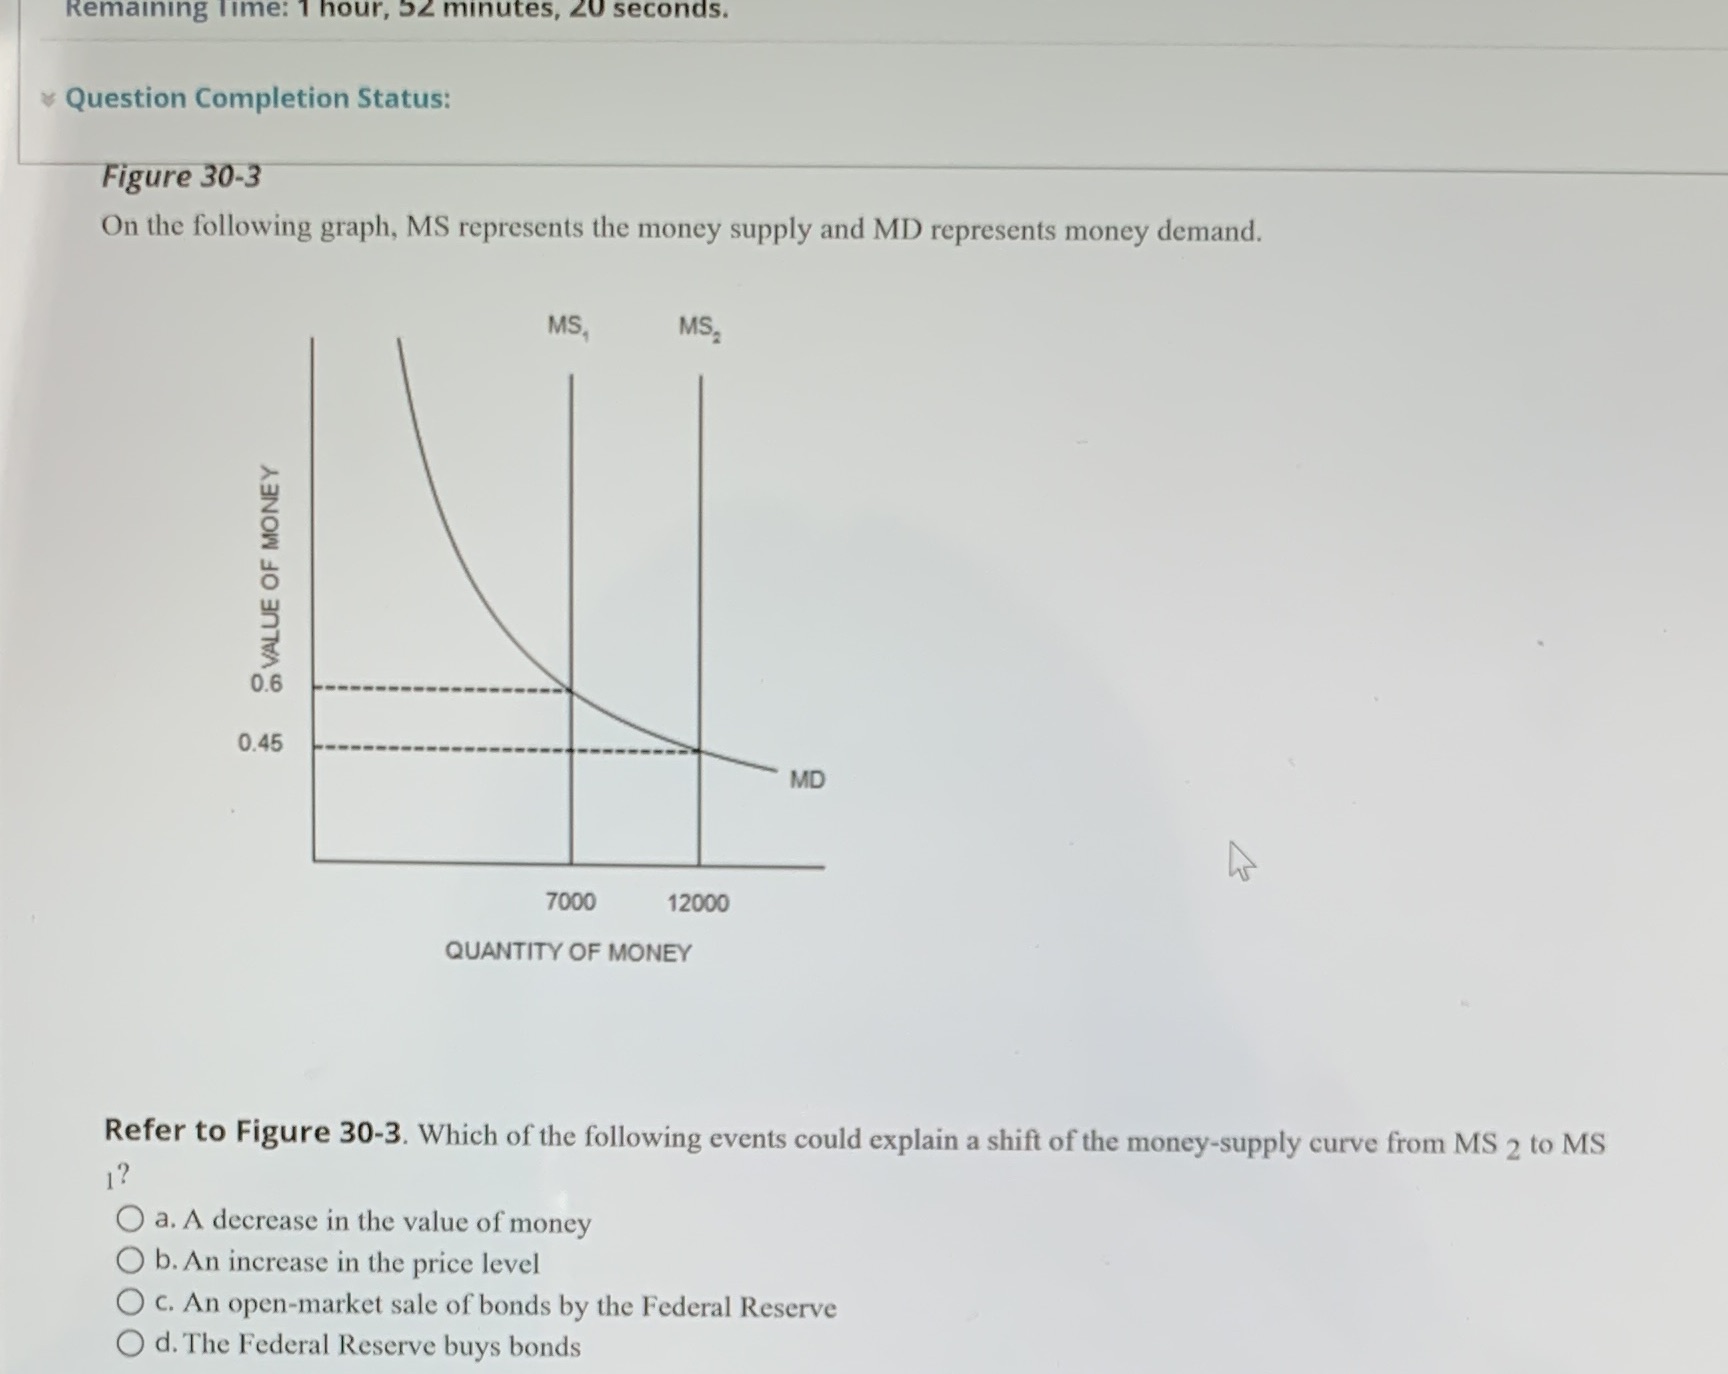
Remaining Time: 1 h 2 minutes, 20 seconds. Question Completion Status: Figure 30-3 On the following graph, MS represents the money supply and MD represents money demand. MS, MS, VALUE OF MONEY 0.45 MD 7000 12000 QUANTITY OF MONEY Refer to Figure 30-3. Which of the following events could explain a shift of the money-supply curve from MS 2 to MS 1? O a. A decrease in the value of money O b. An increase in the price level c. An open-market sale of bonds by the Federal Reserve O d. The Federal Reserve buys bonds
Step by Step Solution
There are 3 Steps involved in it
1 Expert Approved Answer
Step: 1 Unlock

Question Has Been Solved by an Expert!
Get step-by-step solutions from verified subject matter experts
Step: 2 Unlock
Step: 3 Unlock