

Question: Remaining Time: Unlimited Copy and paste the following data into Excel. Create a scatterplot of the data and use the scatterplot to determine if the
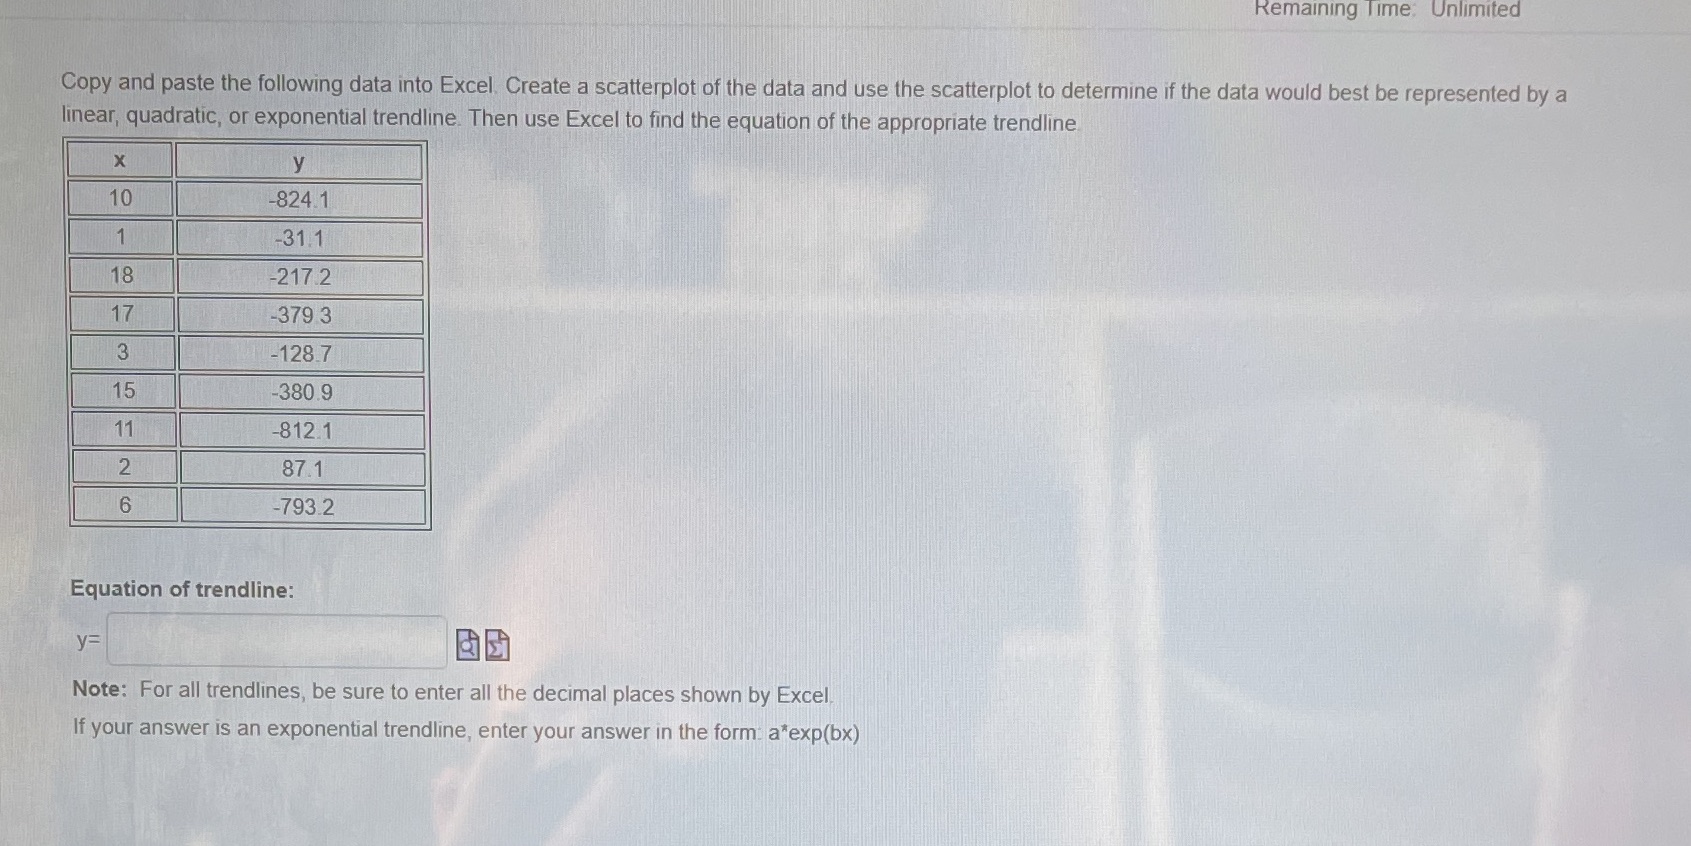
Remaining Time: Unlimited Copy and paste the following data into Excel. Create a scatterplot of the data and use the scatterplot to determine if the data would best be represented by a linear, quadratic, or exponential trendline. Then use Excel to find the equation of the appropriate trendline X y 10 -824.1 1 -31.1 18 -217.2 17 -379 3 3 -128.7 15 380.9 11 -812.1 2 87.1 6 -793.2 Equation of trendline: y= Note: For all trendlines, be sure to enter all the decimal places shown by Excel If your answer is an exponential trendline, enter your answer in the form a*exp(bx)
Step by Step Solution
There are 3 Steps involved in it
1 Expert Approved Answer
Step: 1 Unlock

Question Has Been Solved by an Expert!
Get step-by-step solutions from verified subject matter experts
Step: 2 Unlock
Step: 3 Unlock