

Question: Remember, the expected value of a probability distribution is a statistical measure of the average (mean) value expected to occur during all possible circumstances.
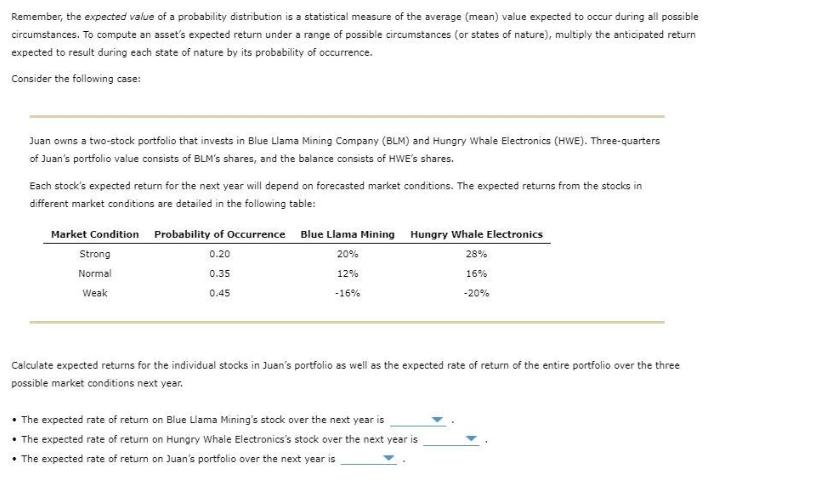
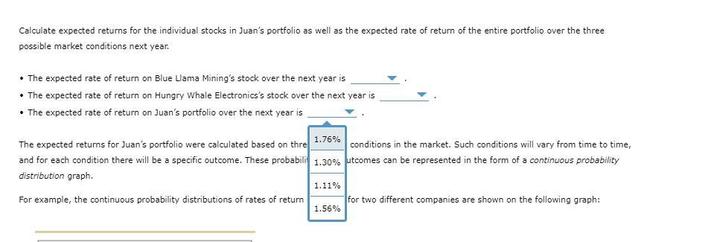
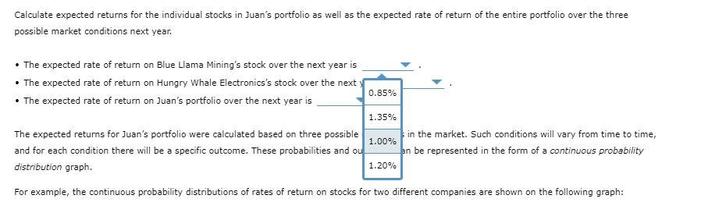
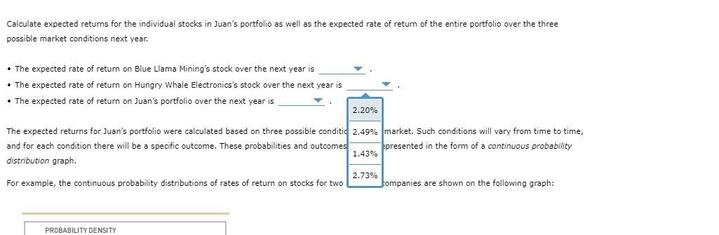
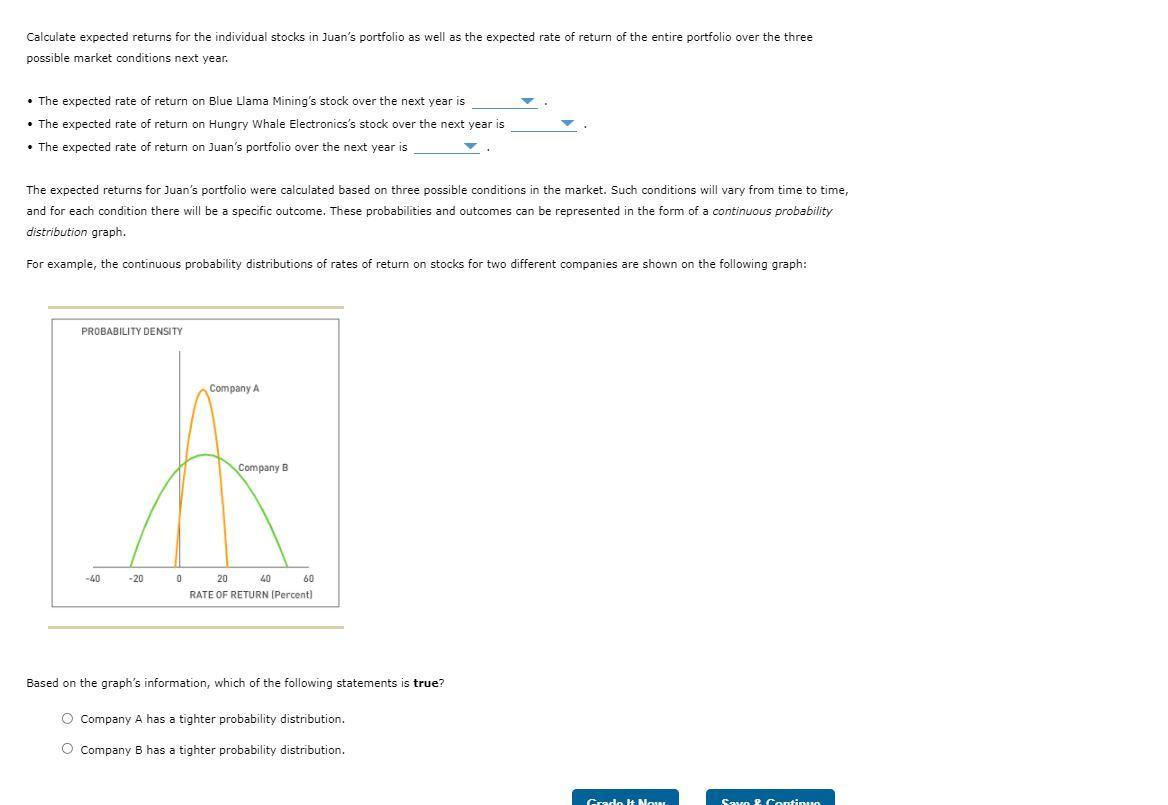

Remember, the expected value of a probability distribution is a statistical measure of the average (mean) value expected to occur during all possible circumstances. To compute an asset's expected return under a range of possible circumstances (or states of nature), multiply the anticipated return expected to result during each state of nature by its probability of occurrence. Consider the following case: Juan owns a two-stock portfolio that invests in Blue Llama Mining Company (BLM) and Hungry Whale Electronics (HWE). Three-quarters of Juan's portfolio value consists of BLM's shares, and the balance consists of HWE's shares. Each stock's expected return for the next year will depend on forecasted market conditions. The expected returns from the stocks in different market conditions are detailed in the following table: Market Condition Probability of Occurrence Blue Llama Mining 0.20 20% 0.35 12% 0.45 -16% Strong Normal Weak Hungry Whale Electronics 28% 16% -20% Calculate expected returns for the individual stocks in Juan's portfolio as well as the expected rate of return of the entire portfolio over the three possible market conditions next year. The expected rate of return on Blue Liama Mining's stock over the next year is The expected rate of return on Hungry Whale Electronics's stock over the next year is The expected rate of return on Juan's portfolio over the next year is Calculate expected returns for the individual stocks in Juan's portfolio as well as the expected rate of return of the entire portfolio over the three possible market conditions next year. The expected rate of return on Blue Llama Mining's stock over the next year is The expected rate of return on Hungry Whale Electronics's stock over the next year is The expected rate of return on Juan's portfolio over the next year is The expected returns for Juan's portfolio were calculated based on thre 1.76% conditions in the market. Such conditions will vary from time to time, and for each condition there will be a specific outcome. These probabili 1.30% utcomes can be represented in the form of a continuous probability distribution graph. For example, the continuous probability distributions of rates of return 1.11% 1.56% for two different companies are shown on the following graph: Calculate expected returns for the individual stocks in Juan's portfolio as well as the expected rate of return of the entire portfolio over the three possible market conditions next year. The expected rate of return on Blue Llama Mining's stock over the next year is The expected rate of return on Hungry Whale Electronics's stock over the next The expected rate of return on Juan's portfolio over the next year is 0.85% 1.35% The expected returns for Juan's portfolio were calculated based on three possible and for each condition there will be a specific outcome. These probabilities and ou distribution graph. For example, the continuous probability distributions of rates of return on stocks for two different companies are shown on the following graph: 1.00% in the market. Such conditions will vary from time to time, an be represented in the form of a continuous probability 1.20% Calculate expected returns for the individual stocks in Juan's portfolio as well as the expected rate of return of the entire portfolio over the three possible market conditions next year. The expected rate of return on Blue Llama Mining's stock over the next year is The expected rate of return on Hungry Whale Electronics's stock over the next year is The expected rate of return on Juan's portfolio over the next year is 2.20% The expected returns for Juan's portfolio were calculated based on three possible conditic 2.49% and for each condition there will be a specific outcome. These probabilities and outcomes distribution graph, 1.43% For example, the continuous probability distributions of rates of return on stocks for two PROBABILITY DENSITY 2.73% market. Such conditions will vary from time to time, presented in the form of a continuous probability tompanies are shown on the following graph: Calculate expected returns for the individual stocks in Juan's portfolio as well as the expected rate of return of the entire portfolio over the three possible market conditions next year. The expected rate of return on Blue Llama Mining's stock over the next year is The expected rate of return on Hungry Whale Electronics's stock over the next year is The expected rate of return on Juan's portfolio over the next year is The expected returns for Juan's portfolio were calculated based on three possible conditions in the market. Such conditions will vary from time to time, and for each condition there will be a specific outcome. These probabilities and outcomes can be represented in the form of a continuous probability distribution graph. For example, the continuous probability distributions of rates of return on stocks for two different companies are shown on the following graph: PROBABILITY DENSITY -40 Company A Company B A 0 20 RATE OF RETURN (Percent) -20 40 60 Based on the graph's information, which of the following statements is true? O Company A has a tighter probability distribution. O Company B has a tighter probability distribution. Grado It Nour Savo & Continuo Calculate expected returns for the individual stocks in Juan's portfolio as well as the expected rate of return of the entire portfolio over the three possible market conditions next year. The expected rate of return on Blue Llama Mining's stock over the next year is The expected rate of return on Hungry Whale Electronics's stock over the next year is The expected rate of return on Juan's portfolio over the next year is 2.20% The expected returns for Juan's portfolio were calculated based on three possible conditic 2.49% and for each condition there will be a specific outcome. These probabilities and outcomes distribution graph, 1.43% For example, the continuous probability distributions of rates of return on stocks for two PROBABILITY DENSITY 2.73% market. Such conditions will vary from time to time, presented in the form of a continuous probability tompanies are shown on the following graph:
Step by Step Solution
3.49 Rating (152 Votes )
There are 3 Steps involved in it
Expected return is the weighted average of individual returns Expected return of Blue L... View full answer

Get step-by-step solutions from verified subject matter experts