

Question: lost on table 2, please help. An equilibrium constant. Table 1: Set of Standard Fe(SCN)? Solutions for Calibration Curve Experiment 3: An Equilibrium Constant Name
lost on table 2, please help. An equilibrium constant.
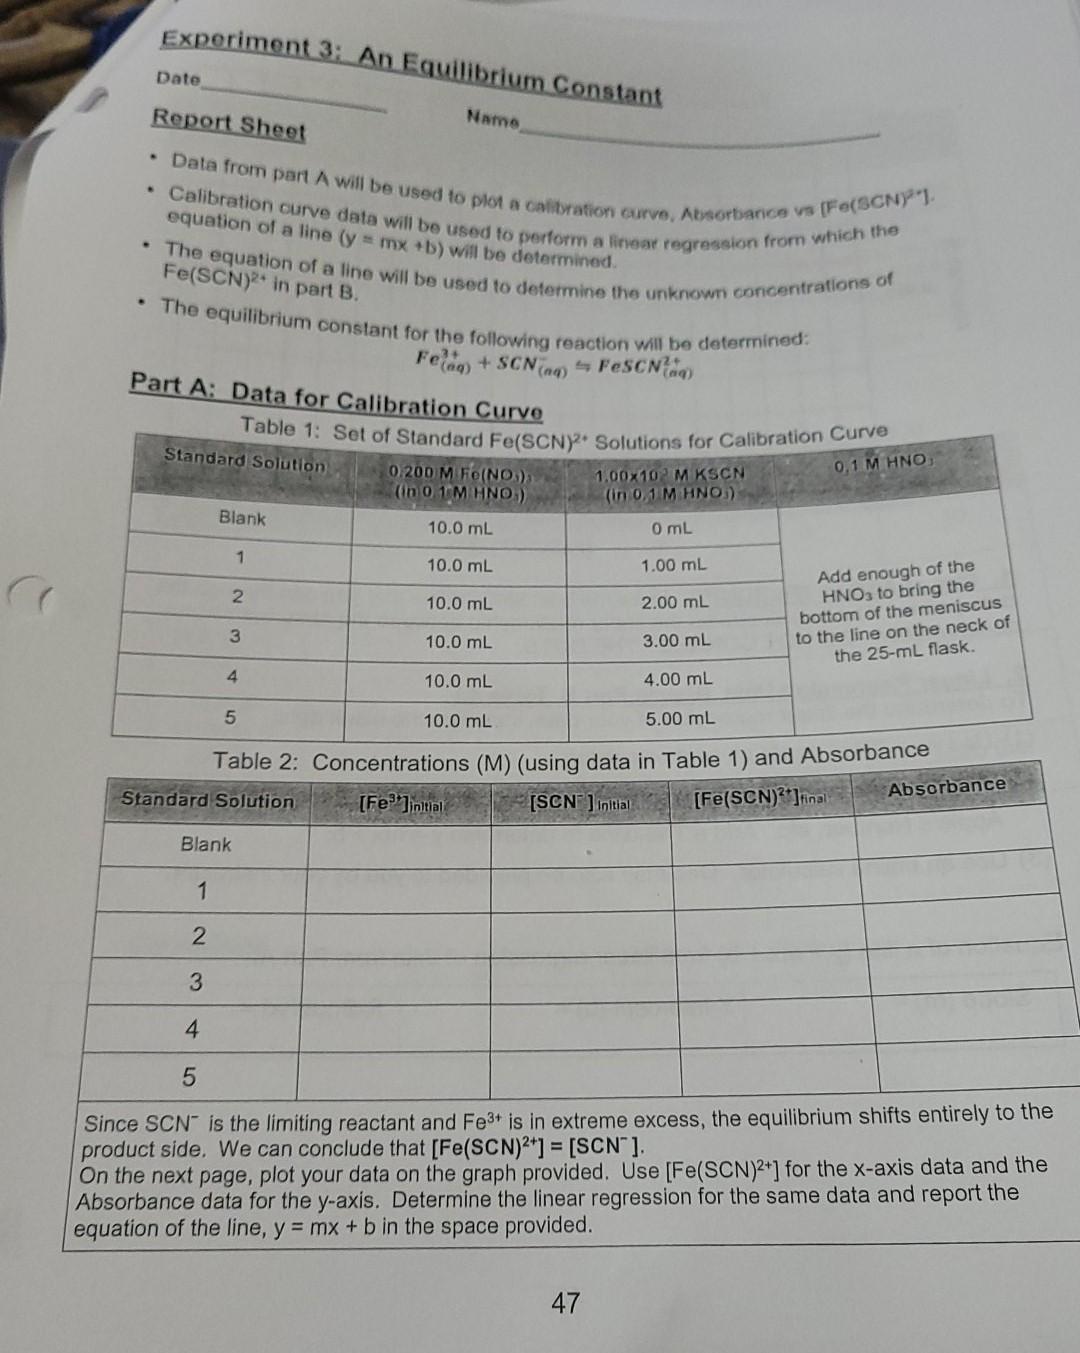
Table 1: Set of Standard Fe(SCN)? Solutions for Calibration Curve Experiment 3: An Equilibrium Constant Name Report Sheet Data from part A will be used to plota calitation curve, Absorbance va Calibration curve data will be used to perform a linear regression from which the The equation of a line will be used to determine the unknown concentrations of The equilibrium constant for the following reaction will be determined: Date Felin +SCNing - FeSCN) equation of a line (y = mx +b) will be determined. [Fe(SCN1 Fe(SCN)2* in part B. Part A: Data for Calibration Curve Standard Solution 0,1 M HNOJ 0.200 M Fe(NO) (in O UM HNO) 1.00x10² MKSCN (in 0,1 M HNO) Blank 10.0 mL O mL 1 10.0 mL 1.00 mL 2 10.0 mL 2.00 mL Add enough of the HNO3 to bring the bottom of the meniscus to the line on the neck of the 25-ml flask. 3 10.0 mL 3.00 mL 4 10.0 mL 4.00 mL 5 10.0 mL 5.00 mL Table 2: Concentrations (M) (using data in Table 1) and Absorbance Standard Solution [Fe]initial Absorbance [SCN) initial [Fe(SCN)2]final Blank 1 2 3 4 5 Since SCN is the limiting reactant and Fe3+ is in extreme excess, the equilibrium shifts entirely to the product side. We can conclude that [Fe(SCN)2+] = [SCN"]. On the next page, plot your data on the graph provided. Use [Fe(SCN)2+] for the x-axis data and the Absorbance data for the y-axis. Determine the linear regression for the same data and report the equation of the line, y = mx + b in the space provided. 47 Table 1: Set of Standard Fe(SCN)? Solutions for Calibration Curve Experiment 3: An Equilibrium Constant Name Report Sheet Data from part A will be used to plota calitation curve, Absorbance va Calibration curve data will be used to perform a linear regression from which the The equation of a line will be used to determine the unknown concentrations of The equilibrium constant for the following reaction will be determined: Date Felin +SCNing - FeSCN) equation of a line (y = mx +b) will be determined. [Fe(SCN1 Fe(SCN)2* in part B. Part A: Data for Calibration Curve Standard Solution 0,1 M HNOJ 0.200 M Fe(NO) (in O UM HNO) 1.00x10² MKSCN (in 0,1 M HNO) Blank 10.0 mL O mL 1 10.0 mL 1.00 mL 2 10.0 mL 2.00 mL Add enough of the HNO3 to bring the bottom of the meniscus to the line on the neck of the 25-ml flask. 3 10.0 mL 3.00 mL 4 10.0 mL 4.00 mL 5 10.0 mL 5.00 mL Table 2: Concentrations (M) (using data in Table 1) and Absorbance Standard Solution [Fe]initial Absorbance [SCN) initial [Fe(SCN)2]final Blank 1 2 3 4 5 Since SCN is the limiting reactant and Fe3+ is in extreme excess, the equilibrium shifts entirely to the product side. We can conclude that [Fe(SCN)2+] = [SCN"]. On the next page, plot your data on the graph provided. Use [Fe(SCN)2+] for the x-axis data and the Absorbance data for the y-axis. Determine the linear regression for the same data and report the equation of the line, y = mx + b in the space provided. 47
Step by Step Solution
There are 3 Steps involved in it

Get step-by-step solutions from verified subject matter experts