

Question: Report the means and standard deviations for each group. State the results of the t-test using the Assume equal variances row. Interpret the statistical results
- Report the means and standard deviations for each group.
- State the results of the t-test using the "Assume equal variances" row.
- Interpret the statistical results against the null hypothesis and state whether it is accepted or rejected.
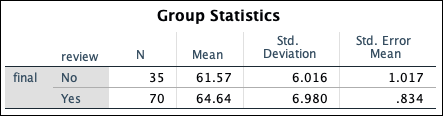
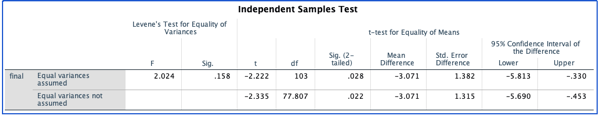
Group Statistics Std. Std. Error review N Mean Deviation Mean final No 35 61.57 6.016 1.017 Yes 70 64.64 6.980 .834Independent Samples Test Levene's Test for Equality of Variances t-test for Equality of Means 95% Confidence Interval of Sig. (2- Mean Std. Error the Difference F Sig. t di tailed) Difference Difference Lower Upper final Equal varlance's 2.024 158 -2.222 103 .028 -3.071 1.382 -5.813 -.330 assumed Equal varlance's not -2.335 77.807 2022 -3.071 1.315 -5.690 -.453 assumed
Step by Step Solution
There are 3 Steps involved in it
1 Expert Approved Answer
Step: 1 Unlock

Question Has Been Solved by an Expert!
Get step-by-step solutions from verified subject matter experts
Step: 2 Unlock
Step: 3 Unlock