

Question: Report the means and standard deviations for each group. State the results of the t-test using the Assume equal variances row. Interpret the statistical results


- Report the means and standard deviations for each group.
- State the results of the t-test using the "Assume equal variances" row.
- Interpret the statistical results against the null hypothesis and state whether it is accepted or rejected.
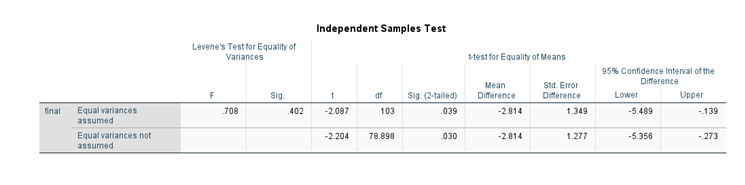
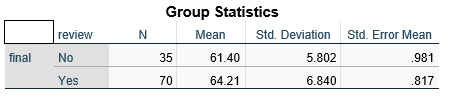
Independent Samples Test Levene's Test for Equality of Variances t-test for Equality of Means 95% Confidence Interval of the Mean Sid. Enor Difference F Sig. Sig. (2-tailed) Difference Difference Lower Upper final Equal variances 708 402 -2.087 103 .039 -2.814 1.349 -5.489 -.139 assumed Equal variances not -2.204 78.898 030 -2.814 1.277 -5.356 -.273 assumedGroup Statistics review N Mean Std. Deviation Std. Error Mean final No 35 61.40 5.802 981 Yes 70 64.21 6.840 .817
Step by Step Solution
There are 3 Steps involved in it
1 Expert Approved Answer
Step: 1 Unlock

Question Has Been Solved by an Expert!
Get step-by-step solutions from verified subject matter experts
Step: 2 Unlock
Step: 3 Unlock