

Question: Thegrades.sav file is a sample SPSS data set. The data represent a teacher's recording of student demographics and performance on quizzes and a final exam
Thegrades.sav file is a sample SPSS data set. The data represent a teacher's recording of student demographics and performance on quizzes and a final exam across three sections of the course. Each section consists of 35 students (N = 105). There are 21 variables in grades.sav.
This week's assignment is on t tests. You will analyze the following variables in thegrades.sav data set:
| SPSS Variable | SPSS Variable |
|---|---|
| Review | Attended review sessions?: 1 = no; 2 = yes |
| Final | Final exam: Number of correct answers |
Step 1: Write Section 1 of the DAA:The Data Analysis Plan
- Name the variables used in this analysis and whether they are categorical or continuous.
- State a research question, null hypothesis, and alternate hypothesis for the independent samples t-test.
Step 2: Write Section 2 of the DAA:Testing Assumptions
Test for one of the assumptions of t tests - homogeneity of variance.
- Create SPSS output showing the Levene's Test for Equality Variances. Run the Levene's test on the dependent variable test for the entire sample. Do not split the data up by review session before running the homogeneity test.
- Paste the table in the DAA.
- Interpret the Levene's test.
Step 3: Write Section 3 of the DAA:Results and Interpretation
Paste the SPSS output of thettest. Below the output:
- Report the means and standard deviations for each group.
- State the results of the t-test using the "Assume equal variances" row.
- Interpret the statistical results against the null hypothesis and state whether it isrejected or not rejected.
Step 4: Write Section 4 of the DAA:Statistical Conclusions
- Provide a brief summary of your analysis and the conclusions drawn about this t test.
- Analyze the limitations of the statistical test and/or possible alternative explanations for your results.
Step 5: Write Section 5 of the DAA:Application
Analyze how you might use the independent samples t test in your field of study.
- Name an independent variable and dependent variable that would work for such an analysis and why studying it may be important to the field or practice.
SPSS Output:
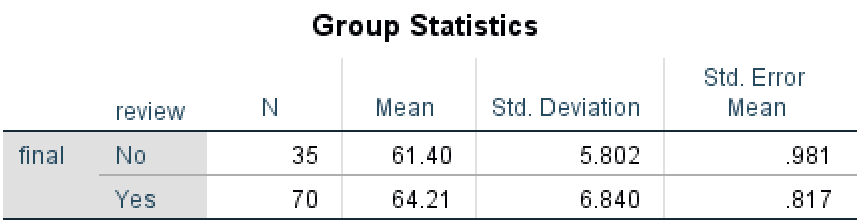
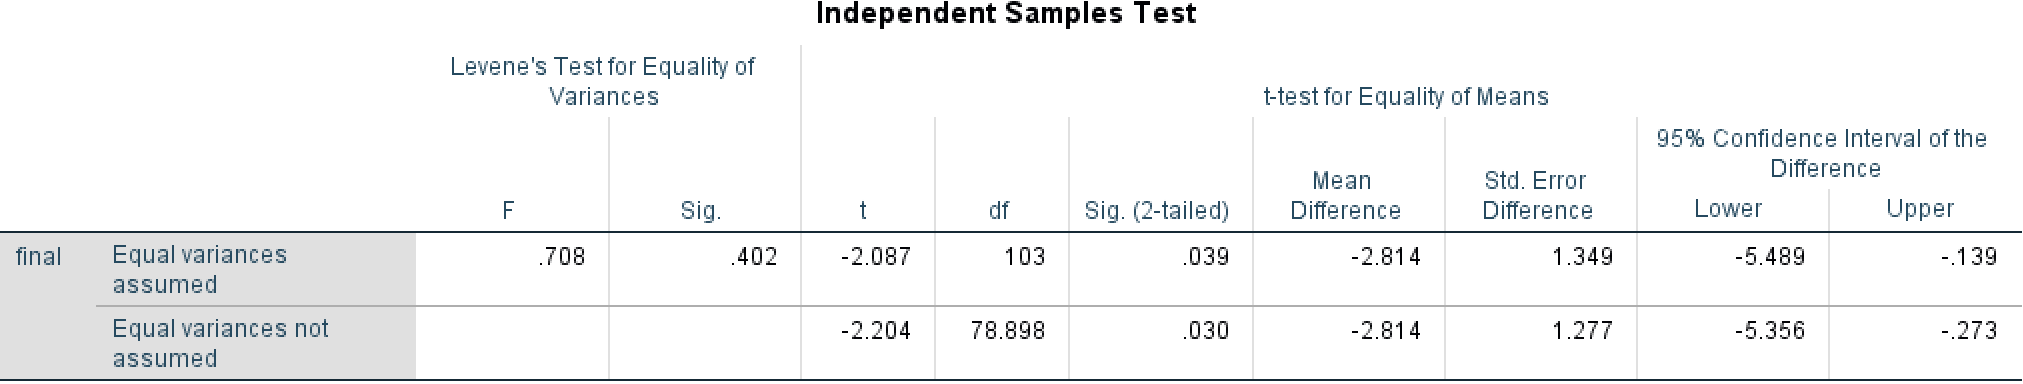
Group Statistics Std. Error review N Mean Std. Deviation Mean final No 35 61.40 5.802 .981 Yes 70 64.21 6.840 817Independent Samples Test Levene's Test for Equality of Variances t-test for Equality of Means 95% Confidence Interval of the Mean Std. Error Difference F Sig. df Sig. (2-tailed) Difference Difference Lower Upper final Equal variances 708 402 -2.087 103 039 -2.814 1.349 -5.489 -.139 assumed Equal variances not -2.204 78.898 030 -2.814 1.277 -5.356 -.273 assumed
Step by Step Solution
There are 3 Steps involved in it

Get step-by-step solutions from verified subject matter experts