

Question: Report - Using Excel To Graph Data Using Excel to Graph Data To complete this experiment, you need to request a data set to work
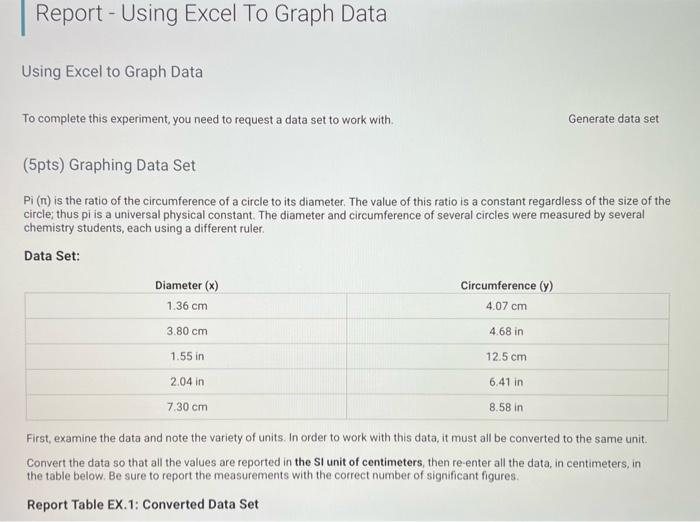
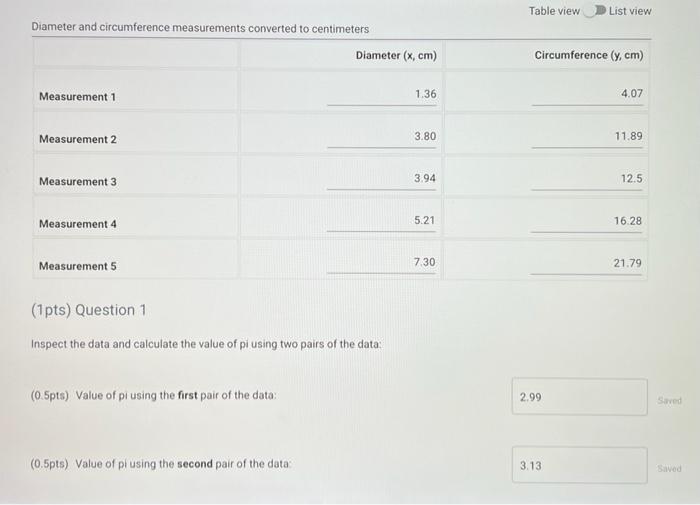
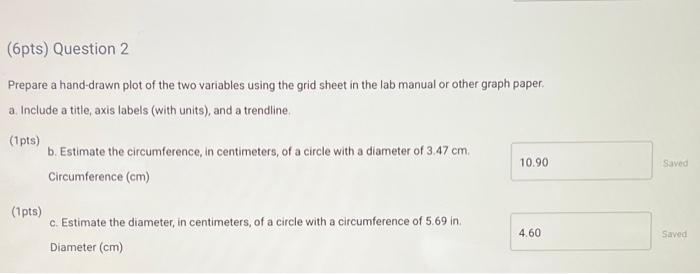
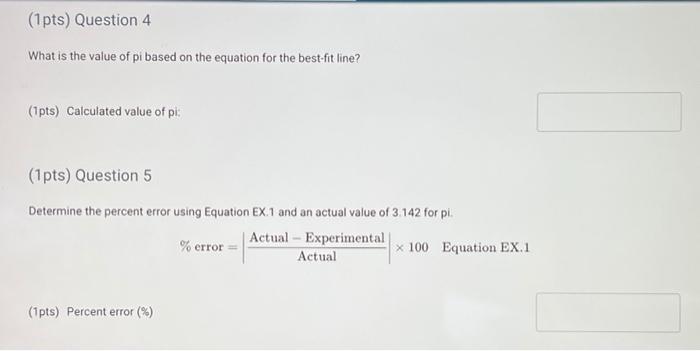
Report - Using Excel To Graph Data Using Excel to Graph Data To complete this experiment, you need to request a data set to work with. Generate data set (5pts) Graphing Data Set Pi (n) is the ratio of the circumference of a circle to its diameter. The value of this ratio is a constant regardless of the size of the circle, thus pi is a universal physical constant. The diameter and circumference of several circles were measured by several chemistry students, each using a different ruler. Data Set: Diameter (*) Circumference (y) 1.36 cm 4.07 cm 3.80 cm 4.68 in 1.55 in 12.5 cm 2.04 in 6.41 in 7.30 cm 8.58 in First, examine the data and note the variety of units. order to work with this data, it must all be converted to the same unit Convert the data so that all the values are reported in the SI unit of centimeters, then re-enter all the data, in centimeters, in the table below. Be sure to report the measurements with the correct number of significant figures. Report Table Ex.1: Converted Data Set Table view List view Diameter and circumference measurements converted to centimeters Diameter (cm) Circumference (y, cm) Measurement 1 1.36 4.07 Measurement 2 3.80 11.89 Measurement 3 3.94 12.5 Measurement 4 5.21 16.28 Measurements 7.30 21.79 (1pts) Question 1 Inspect the data and calculate the value of pi using two pairs of the data. (0.5pts) Value of pi using the first pair of the data 2.99 Saved (0.5pts) Value of pl using the second pair of the data 3.13 Silved (6pts) Question 2 Prepare a hand-drawn plot of the two variables using the grid sheet in the lab manual or other graph paper a Include a title, axis labels (with units), and a trendline (1pts) b. Estimate the circumference, in centimeters, of a circle with a diameter of 3.47 cm. Circumference (cm) 10.90 Saved (1pts) c. Estimate the diameter, in centimeters, of a circle with a circumference of 5.69 in. Diameter (cm) 4.60 Saved (1 pts) Question 4 What is the value of pi based on the equation for the best-fit line? (1pts) Calculated value of pl: (1pts) Question 5 Determine the percent error using Equation EX 1 and an actual value of 3 142 for pi. % error = Actual - Experimental x 100 Equation EX.1 Actual (1 pts) Percent error (%)
Step by Step Solution
There are 3 Steps involved in it

Get step-by-step solutions from verified subject matter experts