

Question: Required: 1. Complete the below table to calculate the trend percents for all components of both statements using 2013 as the base year. 2. Refer

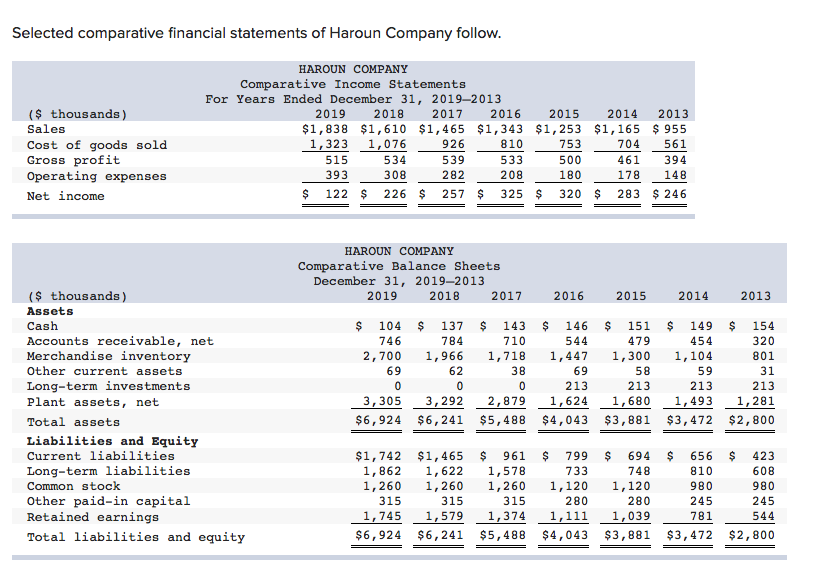
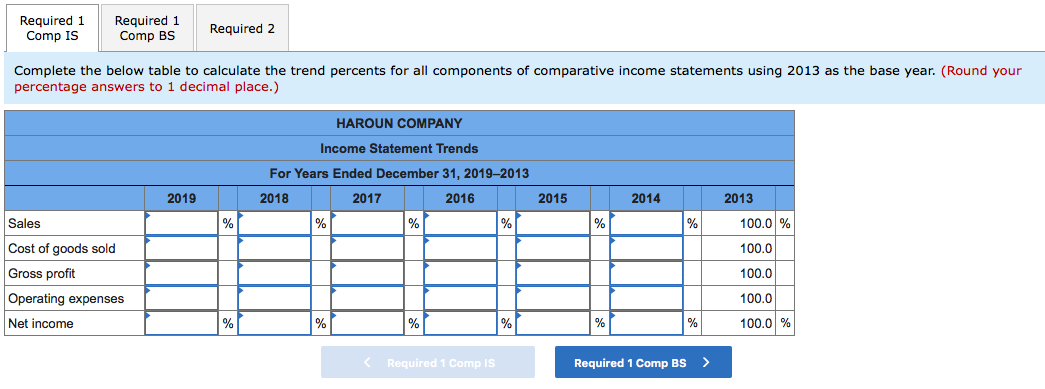
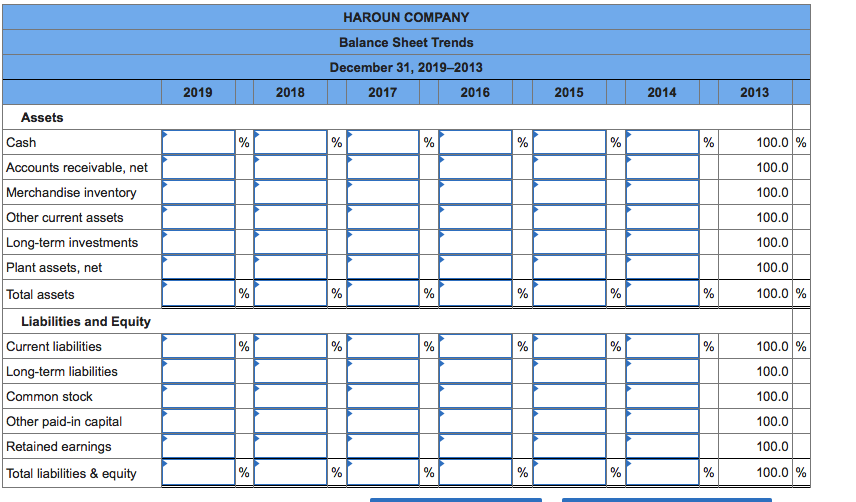
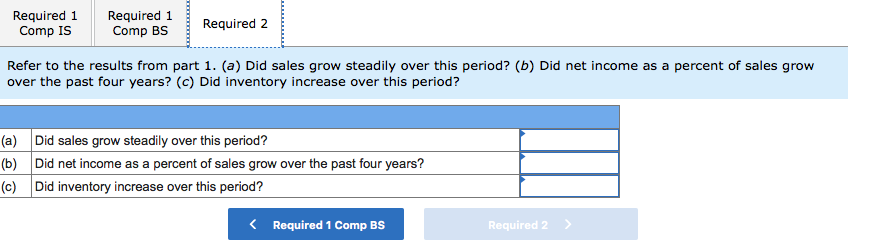
Required: 1. Complete the below table to calculate the trend percents for all components of both statements using 2013 as the base year. 2. Refer to the results from part 1. (a) Did sales grow steadily over this period? (b) Did net income as a percent of sales grow over the past four years? (C) Did inventory increase over this period? Selected comparative financial statements of Haroun Company follow. ($ thousands) Sales Cost of goods sold Gross profit Operating expenses Net income HAROUN COMPANY Comparative Income Statements For Years Ended December 31, 20192013 2019 2018 2017 2016 2015 2014 2013 $1,838 $1,610 $1,465 $1,343 $1,253 $1,165 $ 955 1,323 1,076 926 810 753 704 561 515 534 539 533 500 461 394 393308 282 208 180 178 148 $ 122 $ 226 $ 257 $ 325 $ 320 $ 283 $ 246 HAROUN COMPANY Comparative Balance Sheets December 31, 20192013 2019 2018 2017 2016 2015 2014 2013 $ 104 746 2,700 $ 149 $ 454 1,104 154 320 801 $ 137 784 1,966 62 0 3,292 $6,241 69 $ 143 $ 146 $ 151 710 544479 1,718 1,447 1,300 38 58 213 213 2,8791,624 1,680 $5,488 $4,043 $3,881 69 0 59 ($ thousands) Assets Cash Accounts receivable, net Merchandise inventory Other current assets Long-term investments Plant assets, net Total assets Liabilities and Equity Current liabilities Long-term liabilities Common stock Other paid-in capital Retained earnings Total liabilities and equity 31 3, 305 $6,924 213 1,493 $3,472 213 1,281 $2,800 $1,742 1,862 1,260 315 1,745 $6,924 $1,465 1,622 1,260 315 1,579 $6,241 $ 961 $ 799 1,578 733 1,260 1,120 315 280 1,374 1,111 $5,488 $4,043 $ 694 $ 656 748 810 1,120 980 280 245 1,039 781 $3,881 $3,472 $ 423 608 980 245 544 $2,800 Required 1 Comp IS Required 1 Comp BS Required 2 Complete the below table to calculate the trend percents for all components of comparative income statements using 2013 as the base year. (Round your percentage answers to 1 decimal place.) HAROUN COMPANY Income Statement Trends For Years Ended December 31, 2019-2013 2018 2017 2016 2019 2015 2014 2013 % Sales Cost of goods sold Gross profit Operating expenses Net income 100.0 % 100.0 100.0 100.0 100.0 % HAROUN COMPANY Balance Sheet Trends December 31, 2019-2013 2017 2016 2019 2018 2015 2014 2013 Assets Cash Accounts receivable, net Merchandise inventory Other current assets Long-term investments Plant assets, net Total assets 100.0 % 100.0 100.0 100.0 100.0 100.0 100.0 % Liabilities and Equity Current liabilities Long-term liabilities Common stock 100.0 % 100.0 100.0 100.0 100.0 100.0 % Other paid-in capital Retained earnings Total liabilities & equity % Required 1 Comp IS Required 1 Comp BS Required 2 Refer to the results from part 1. (a) Did sales grow steadily over this period? (b) Did net income as a percent of sales grow over the past four years? (C) Did inventory increase over this period? (a) (b) (c) Did sales grow steadily over this period? Did net income as a percent of sales grow over the past four years? Did inventory increase over this period?
Step by Step Solution
There are 3 Steps involved in it

Get step-by-step solutions from verified subject matter experts