

Question: Required: 1. Using fiscal 2017 as the base year, compute trend percents for fiscal years 2017, 2018, and 2019 for total net sales, total
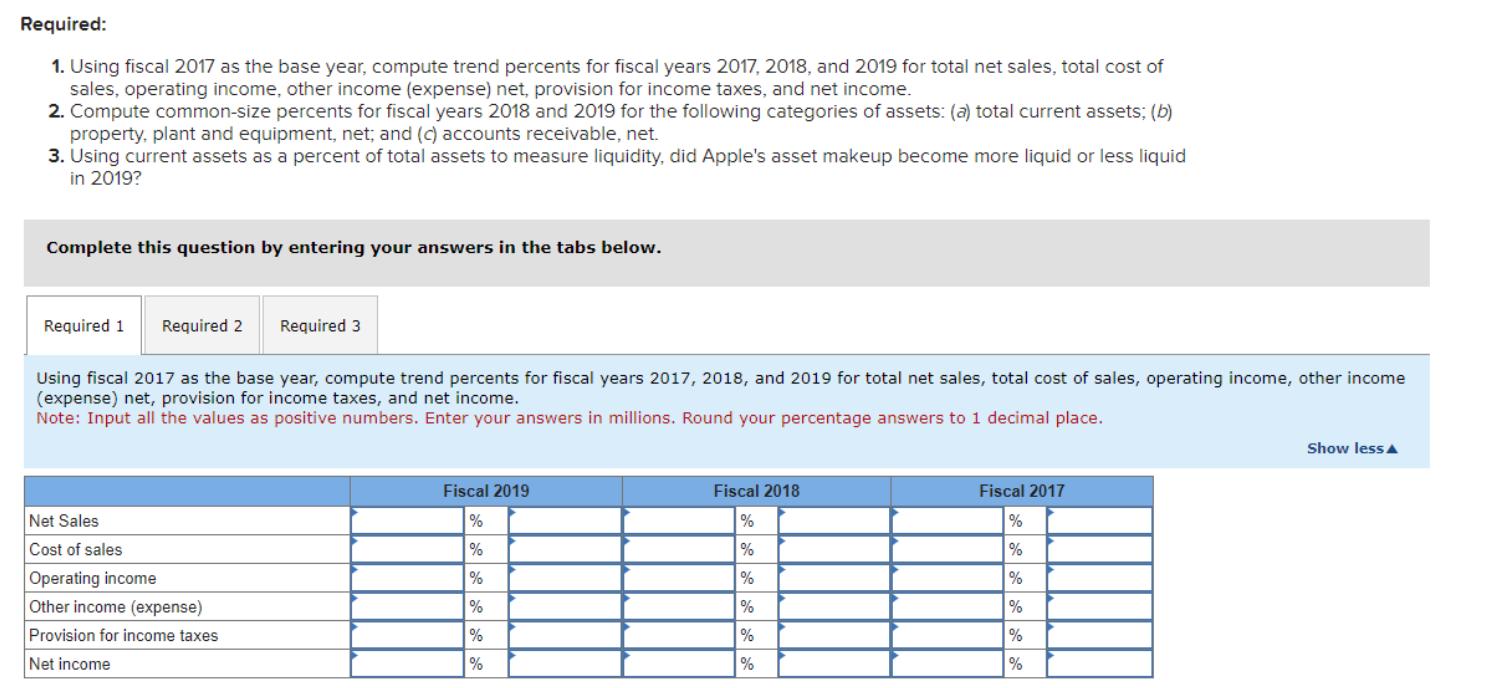
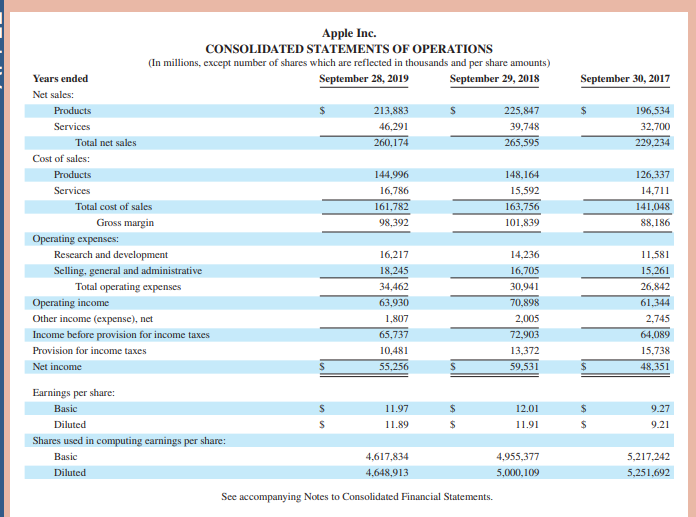
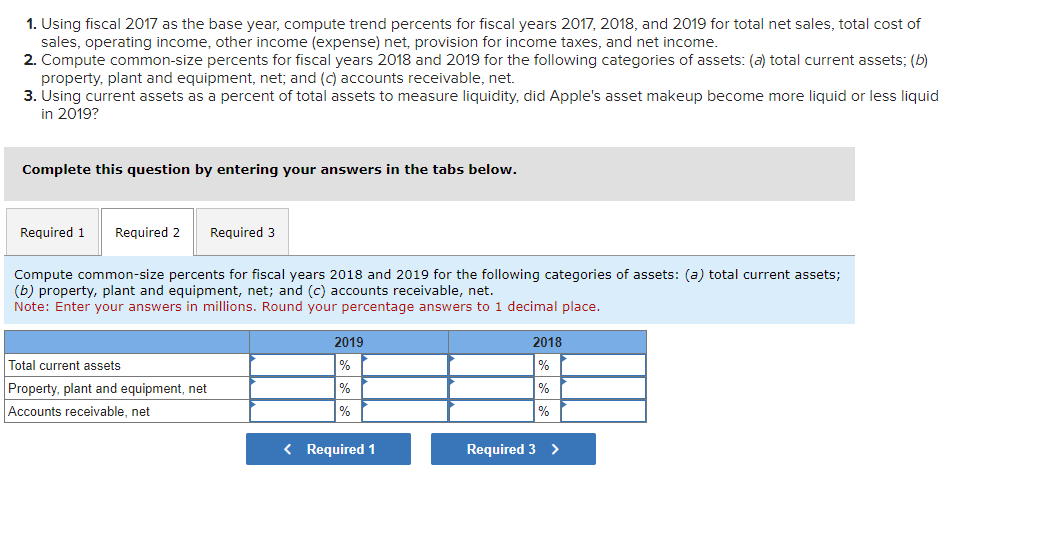
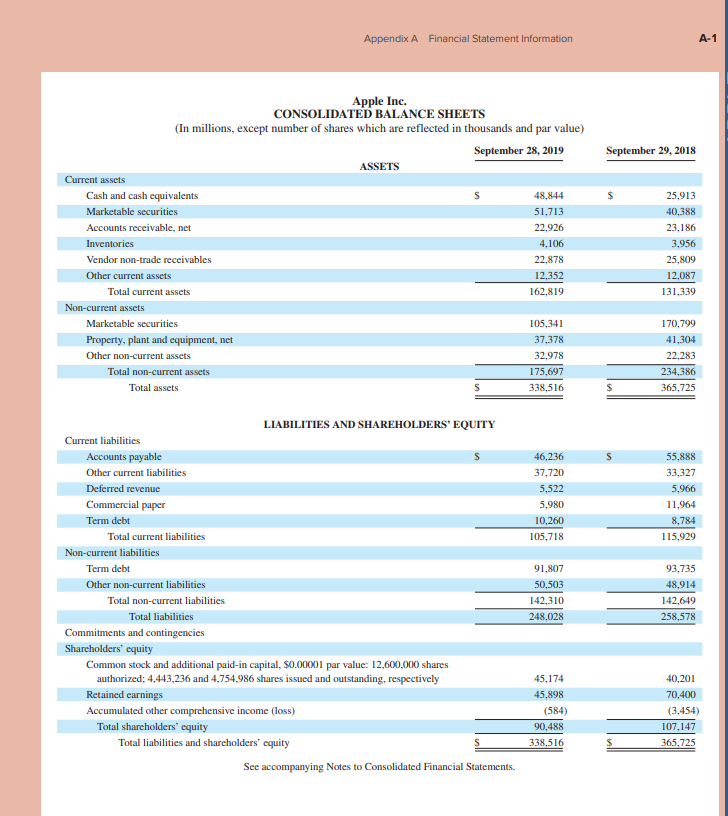
Required: 1. Using fiscal 2017 as the base year, compute trend percents for fiscal years 2017, 2018, and 2019 for total net sales, total cost of sales, operating income, other income (expense) net, provision for income taxes, and net income. 2. Compute common-size percents for fiscal years 2018 and 2019 for the following categories of assets: (a) total current assets; (b) property, plant and equipment, net; and (c) accounts receivable, net. 3. Using current assets as a percent of total assets to measure liquidity, did Apple's asset makeup become more liquid or less liquid in 2019? Complete this question by entering your answers in the tabs below. Required 1 Required 2 Required 3 Using fiscal 2017 as the base year, compute trend percents for fiscal years 2017, 2018, and 2019 for total net sales, total cost of sales, operating income, other income (expense) net, provision for income taxes, and net income. Note: Input all the values as positive numbers. Enter your answers in millions. Round your percentage answers to 1 decimal place. Net Sales Fiscal 2019 % Fiscal 2018 Fiscal 2017 % % Cost of sales % % % Operating income % % % Other income (expense) % % % Provision for income taxes % % % Net income % % % Show less Years ended Net sales: Products Services Total net sales Cost of sales: Products Apple Inc. CONSOLIDATED STATEMENTS OF OPERATIONS (In millions, except number of shares which are reflected in thousands and per share amounts) Services Total cost of sales Gross margin Operating expenses: Research and development Selling, general and administrative Total operating expenses Operating income Other income (expense), net Income before provision for income taxes Provision for income taxes Net income Earnings per share: Basic September 28, 2019 September 29, 2018 September 30, 2017 213,883 225,847 $ 196,534 46,291 39,748 32,700 260,174 265,595 229,234 144,996 148,164 126,337 16,786 15,592 14,711 161,782 163,756 141,048 98,392 101,839 88,186 16,217 14,236 11,581 18,245 16,705 15,261 34,462 30,941 26,842 63,930 70,898 61,344 1,807 2,005 2,745 65,737 72,903 64,089 10,481 13,372 15,738 55,256 S 59,531 48,351 11.97 $ 12.01 $ 9.27 Diluted S 11.89 $ 11.91 $ 9.21 Shares used in computing earnings per share: Basic Diluted 4,617,834 4,648,913 4,955,377 5,000,109 5,217,242 5,251,692 See accompanying Notes to Consolidated Financial Statements. 1. Using fiscal 2017 as the base year, compute trend percents for fiscal years 2017, 2018, and 2019 for total net sales, total cost of sales, operating income, other income (expense) net, provision for income taxes, and net income. 2. Compute common-size percents for fiscal years 2018 and 2019 for the following categories of assets: (a) total current assets; (b) property, plant and equipment, net; and (c) accounts receivable, net. 3. Using current assets as a percent of total assets to measure liquidity, did Apple's asset makeup become more liquid or less liquid in 2019? Complete this question by entering your answers in the tabs below. Required 1 Required 2 Required 3 Compute common-size percents for fiscal years 2018 and 2019 for the following categories of assets: (a) total current assets; (b) property, plant and equipment, net; and (c) accounts receivable, net. Note: Enter your answers in millions. Round your percentage answers to 1 decimal place. Total current assets Property, plant and equipment, net Accounts receivable, net 2019 2018 % % % % % % < Required 1 Required 3 > Current assets Appendix A Financial Statement Information A-1 Apple Inc. CONSOLIDATED BALANCE SHEETS (In millions, except number of shares which are reflected in thousands and par value) Cash and cash equivalents Marketable securities Accounts receivable, net Inventories Vendor non-trade receivables Other current assets Total current assets Non-current assets Marketable securities Property, plant and equipment, net Other non-current assets Total non-current assets Total assets Current liabilities Accounts payable Other current liabilities Deferred revenue Commercial paper Term debt Total current liabilities Non-current liabilities Term debt Other non-current liabilities Total non-current liabilities Total liabilities Commitments and contingencies Shareholders' equity ASSETS September 28, 2019 September 29, 2018 S 48,844 25,913 51,713 40,388 22,926 23,186 4,106 3,956 22,878 25,809 12,352 12,087 162,819 131,339 105,341 170,799 37,378 41,304 32,978 22,283 175,697 234,386 338,516 365,725 LIABILITIES AND SHAREHOLDERS' EQUITY Common stock and additional paid-in capital, $0.00001 par value: 12,600,000 shares 46,236 55,888 37,720 33,327 5,522 5,966 5,980 11,964 10,260 8,784 105,718 115,929 91,807 93,735 50,503 48,914 142,310 142,649 248,028 258,578 authorized; 4,443,236 and 4,754,986 shares issued and outstanding, respectively 45,174 40,201 Retained earnings 45,898 70,400 Accumulated other comprehensive income (loss) (584) (3,454) Total shareholders' equity 90,488 107,147 Total liabilities and shareholders' equity S 338,516 $ 365,725 See accompanying Notes to Consolidated Financial Statements.
Step by Step Solution
There are 3 Steps involved in it
Sure lets solve the questions step by step Required 1 Compute trend percents using fiscal 2017 as the base year The formula for the trend percentage is Trend Percentage Figure of Current Year Figure o... View full answer

Get step-by-step solutions from verified subject matter experts