Question: Required: 3.1.Identify the independent variable (IV) and dependent variable (DV) used in the study. 3.2. What are the levels of measurement of the independent variable

Required:
3.1.Identify the independent variable (IV) and dependent variable (DV) used in the study.
3.2. What are the levels of measurement of the independent variable (IV) and dependent variable (DV)?
3.3.What does the scatter plot (Figure 3.3) suggest about the relations between Family wealth and Birthweight? 3.4.Uncertain if the data met the requirements for parametric tests, the researchers opted for both Pearsons correlation
coefficient and Spearmans rho in a correlational analysis of the data. The outputs of the Pearsons r and Spearmans rho
are depicted in Figure3.1 and Figure 3.2, respectively.
3.4.1. Identify THREE (3) assumptions of parametric tests. (3 marks) 3.4.2.Suppose that the researchers decide not to test the data for parametric assumptions, can they conclude, on the basis of
the outputs of the correlation analysis ONLY, that there exists a significant, strong, positive correlation between Family
wealth and Birthweight? Explain. (5 marks)
3.4.3.Does the conclusion in 3.4.2 in any way dispel any notion of causal ambiguity between family wealth and
birthweight? (2 marks) 3.4.4.Discuss any TWO (2) major weaknesses of the study and suggest relevant ways to address them. (4 marks)
 Required: 3.1.Identify the independent variable (IV) and dependent variable (DV) used
in the study. 3.2. What are the levels of measurement of the

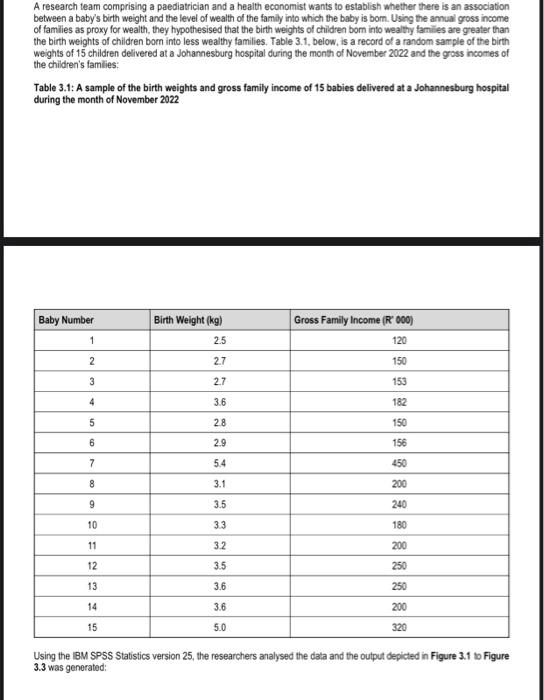
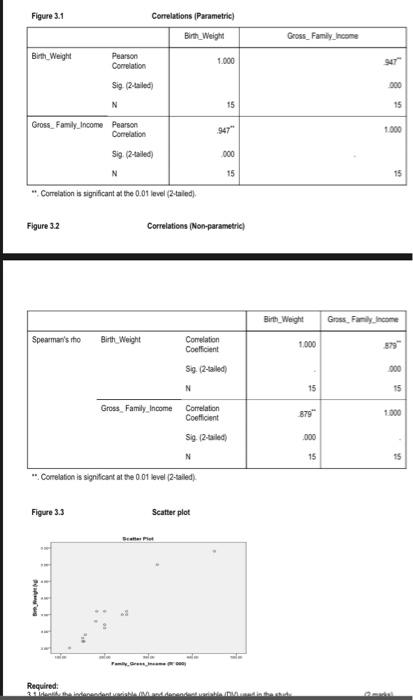
A research team comprising a paediatrician and a health economist wants to establish whether there is an association between a baby's birth weight and the level of wealth of the family into which the baby is bom. Using the amual gross income of families as proxy for wealth, they hypothesised that the birth weights of children born into wealthy familes are greater than the birth weights of children born into less wealthy families. Table 3.1, below, is a record of a random sarple of the birth weights of 15 children delivered at a Johannesburg hospital during the month of November 2022 and the gross incomes of the children's famlies: Table 3.1: A sample of the birth weights and gross family income of 15 babies delivered at a Johannesburg hospital during the month of November 2022 Using the IBM SPSS Statistics version 25, the researchers analysed the data and the output depicted in Figure 3.1 it Figure 3.3 was generated: Figure 3.1 Correlations (Parametric) " ". Correiation is significant at the 0.01 level (2-taled). Figure 3.2 Correlations (Non-parametric) "Conelation is significant at the 0.01 level (2-tailed)

Step by Step Solution

There are 3 Steps involved in it

1 Expert Approved Answer
Step: 1 Unlock blur-text-image
Question Has Been Solved by an Expert!

Get step-by-step solutions from verified subject matter experts

Step: 2 Unlock
Step: 3 Unlock

Students Have Also Explored These Related General Management Questions!