

Question: Required information Consider the data set. Plot the data and the equation on both standard and semilogarithmic graphs with the MATLAB subplot function. (Please upload
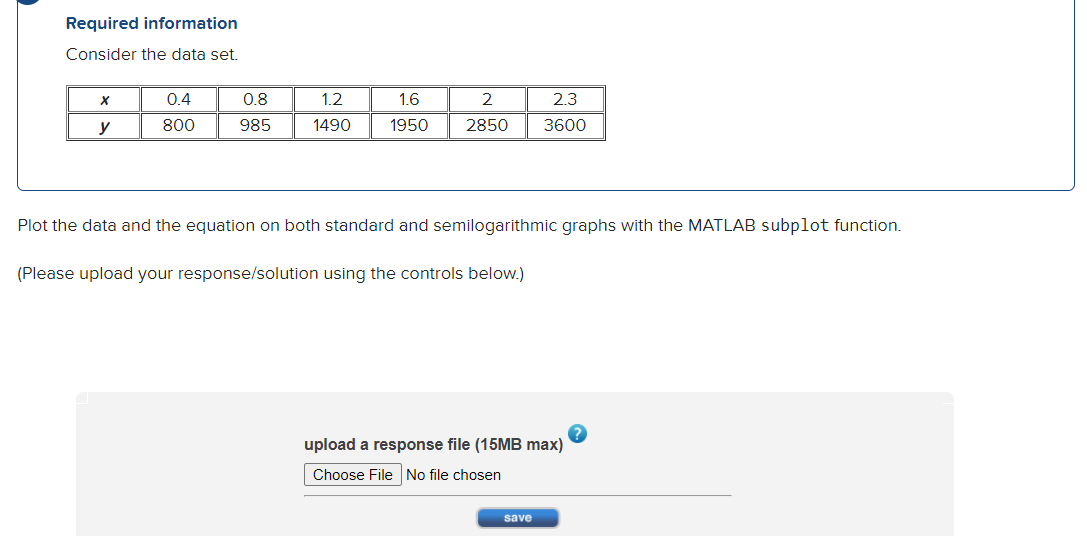
Required information Consider the data set. Plot the data and the equation on both standard and semilogarithmic graphs with the MATLAB subplot function. (Please upload your response/solution using the controls below.) upload a response file (15MB max)
Step by Step Solution
There are 3 Steps involved in it
1 Expert Approved Answer
Step: 1 Unlock

Question Has Been Solved by an Expert!
Get step-by-step solutions from verified subject matter experts
Step: 2 Unlock
Step: 3 Unlock