

Question: ! Required information DV 3 - 1 ( LO 3 . 1 , 3 . 3 , 3 . 5 , 3 . 6 ,
Required information
DV LO Let's see how using a visualization...
The following information applies to the question's displayed below.
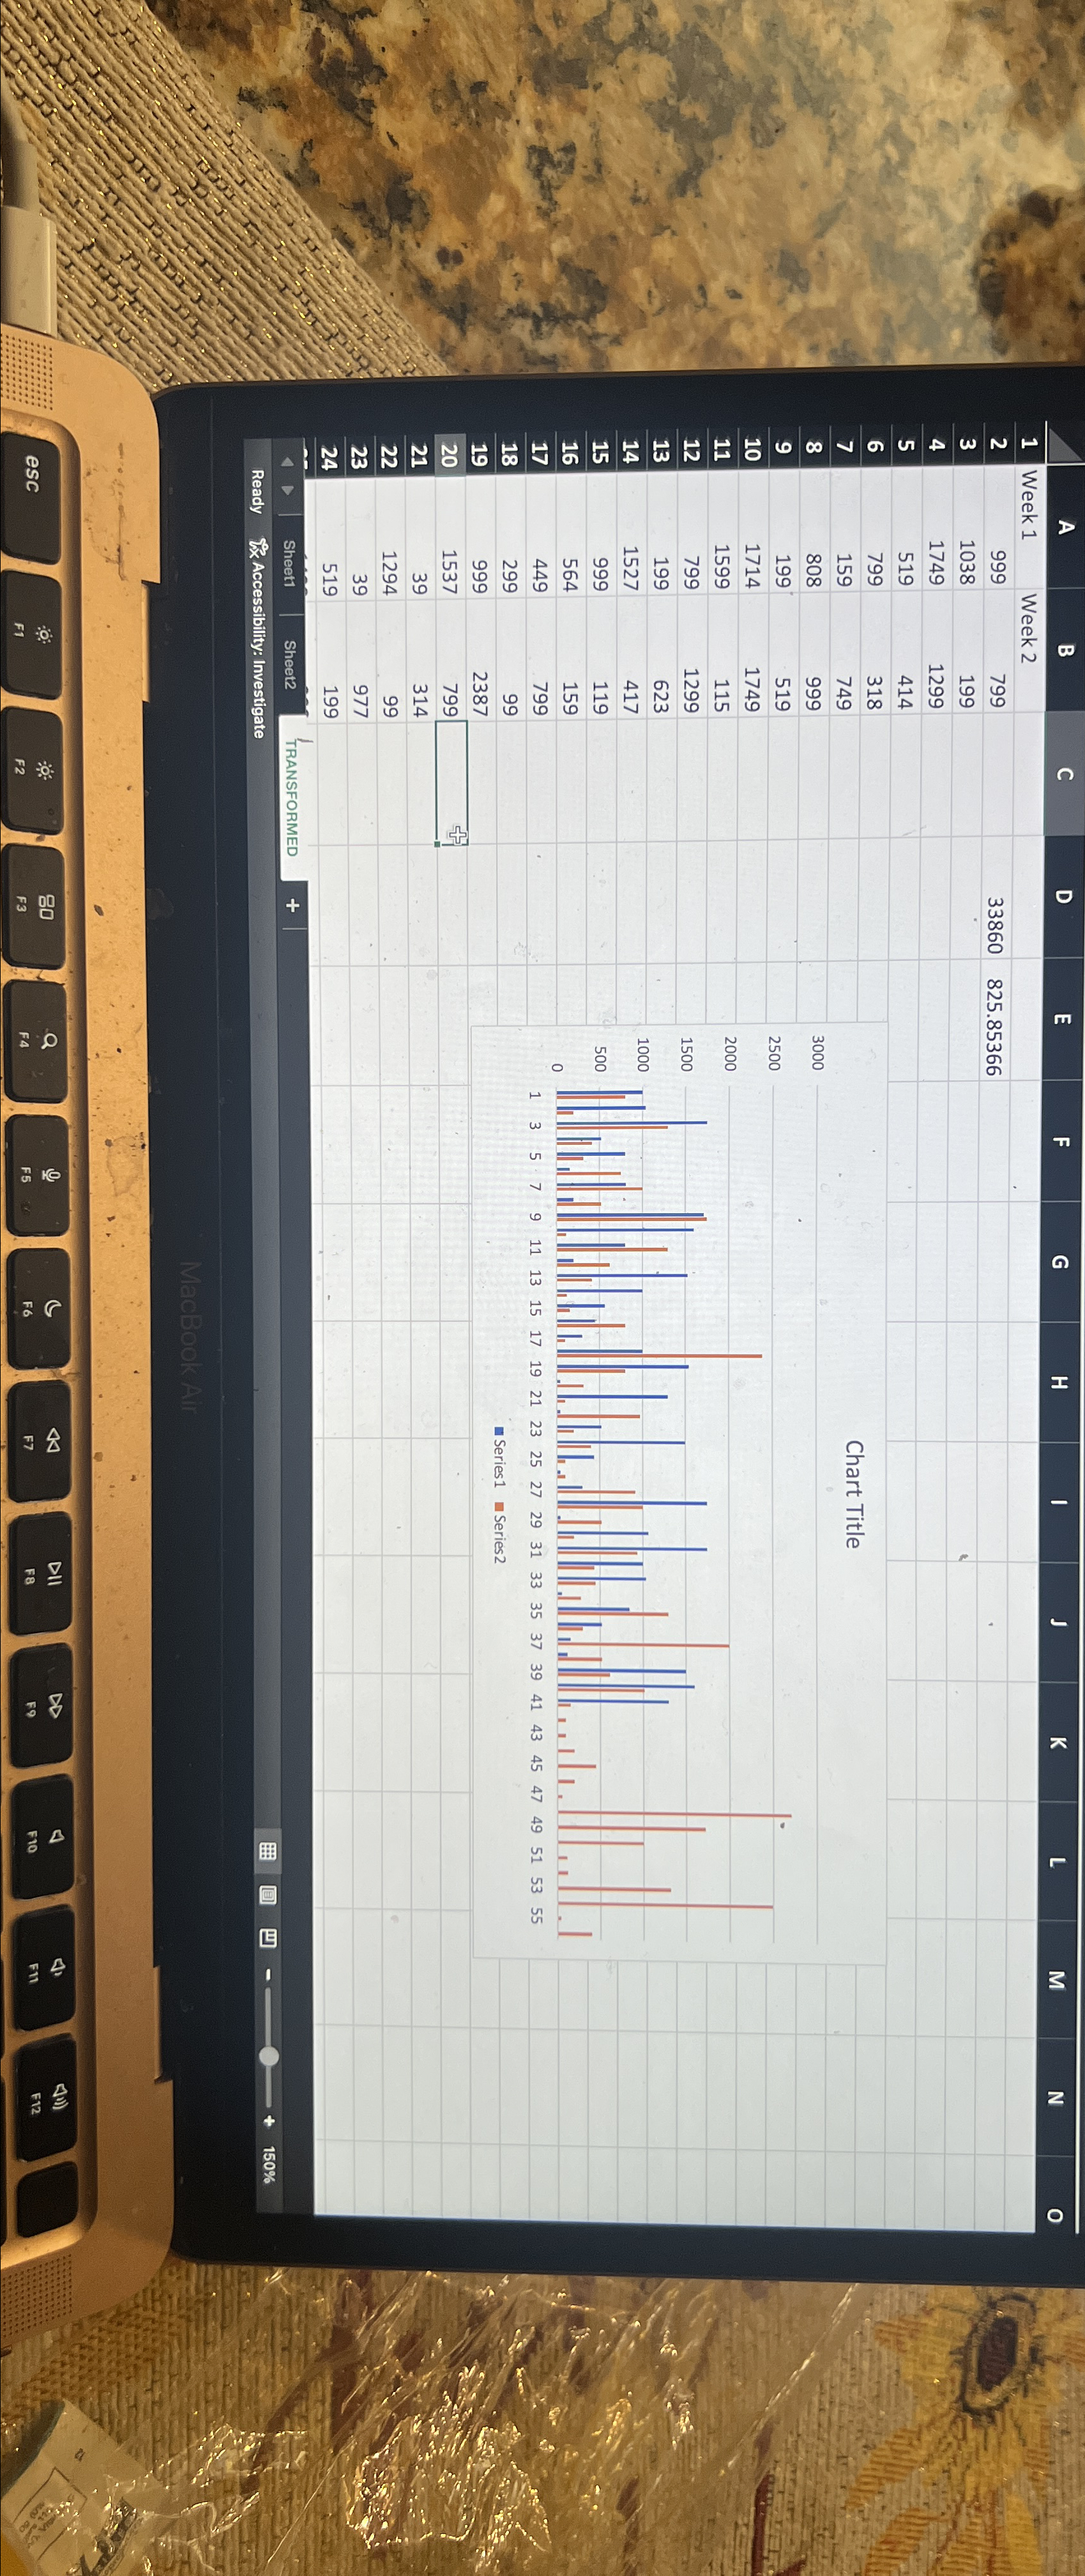
Let's see how using a visualization can assist with data analysis. We will use a transformed version of the data in the file titled Skydio Drone dataset TRANSFORMED.xIsx. This is a transformed version of the dataset used in Problems This transformed file splits the first two weeks of data into two groups and lists each individual invoice amount. In the following three steps, assess if the average invoice for Week is significantly different than the average invoice for Week
Complete the following steps:
DV LO Part g
g Why do you think it is important not only to visually assess the differences between two datasets as you did with the bar chart in this problem but also to run a test to assess for statistical significance of the differences?
Step by Step Solution
There are 3 Steps involved in it
1 Expert Approved Answer
Step: 1 Unlock

Question Has Been Solved by an Expert!
Get step-by-step solutions from verified subject matter experts
Step: 2 Unlock
Step: 3 Unlock