Question: Required Question: Using Realtor.com, find a condominium property in Chicago for sale and a highly comparable condominium (preferably in the same building) for rent. If
Required Question: Using Realtor.com, find a condominium property in Chicago for sale and a highly comparable condominium (preferably in the same building) for rent. If you had to choose between renting vs owning this unit, what would you do? How much leverage should you use to finance the acquisition? Write a short report outlining your rent vs own decision. Carefully, state your assumptions (e.g., rental growth rate, property price growth rate, homeownership expenses, and so on). Assume that you have sufficient funds to purchase the property using cash only but you may use up to 96.5% LTV financing. Also, assume that you will live in the property for only four years. You are expected to use the provided Excel document below to guide your decision and to provide pictures (e.g., screenshots) of the comparable properties as exhibits appended to your essay. The Excel file is already populated as an example. However, you are expected to adjust the assumptions and formulas of the Excel provided to match the property you are analyzing. I want to encourage you to use real-world data and match your numbers to as close to reality as possible. There will be no minimum or maximum word limit. Please bring a hard copy of a document that includes: (1) your name, (2) your response, (3) screenshots of the subject property listings, and (4) screenshots of the Excel model/table. Email submissions will not be accepted.
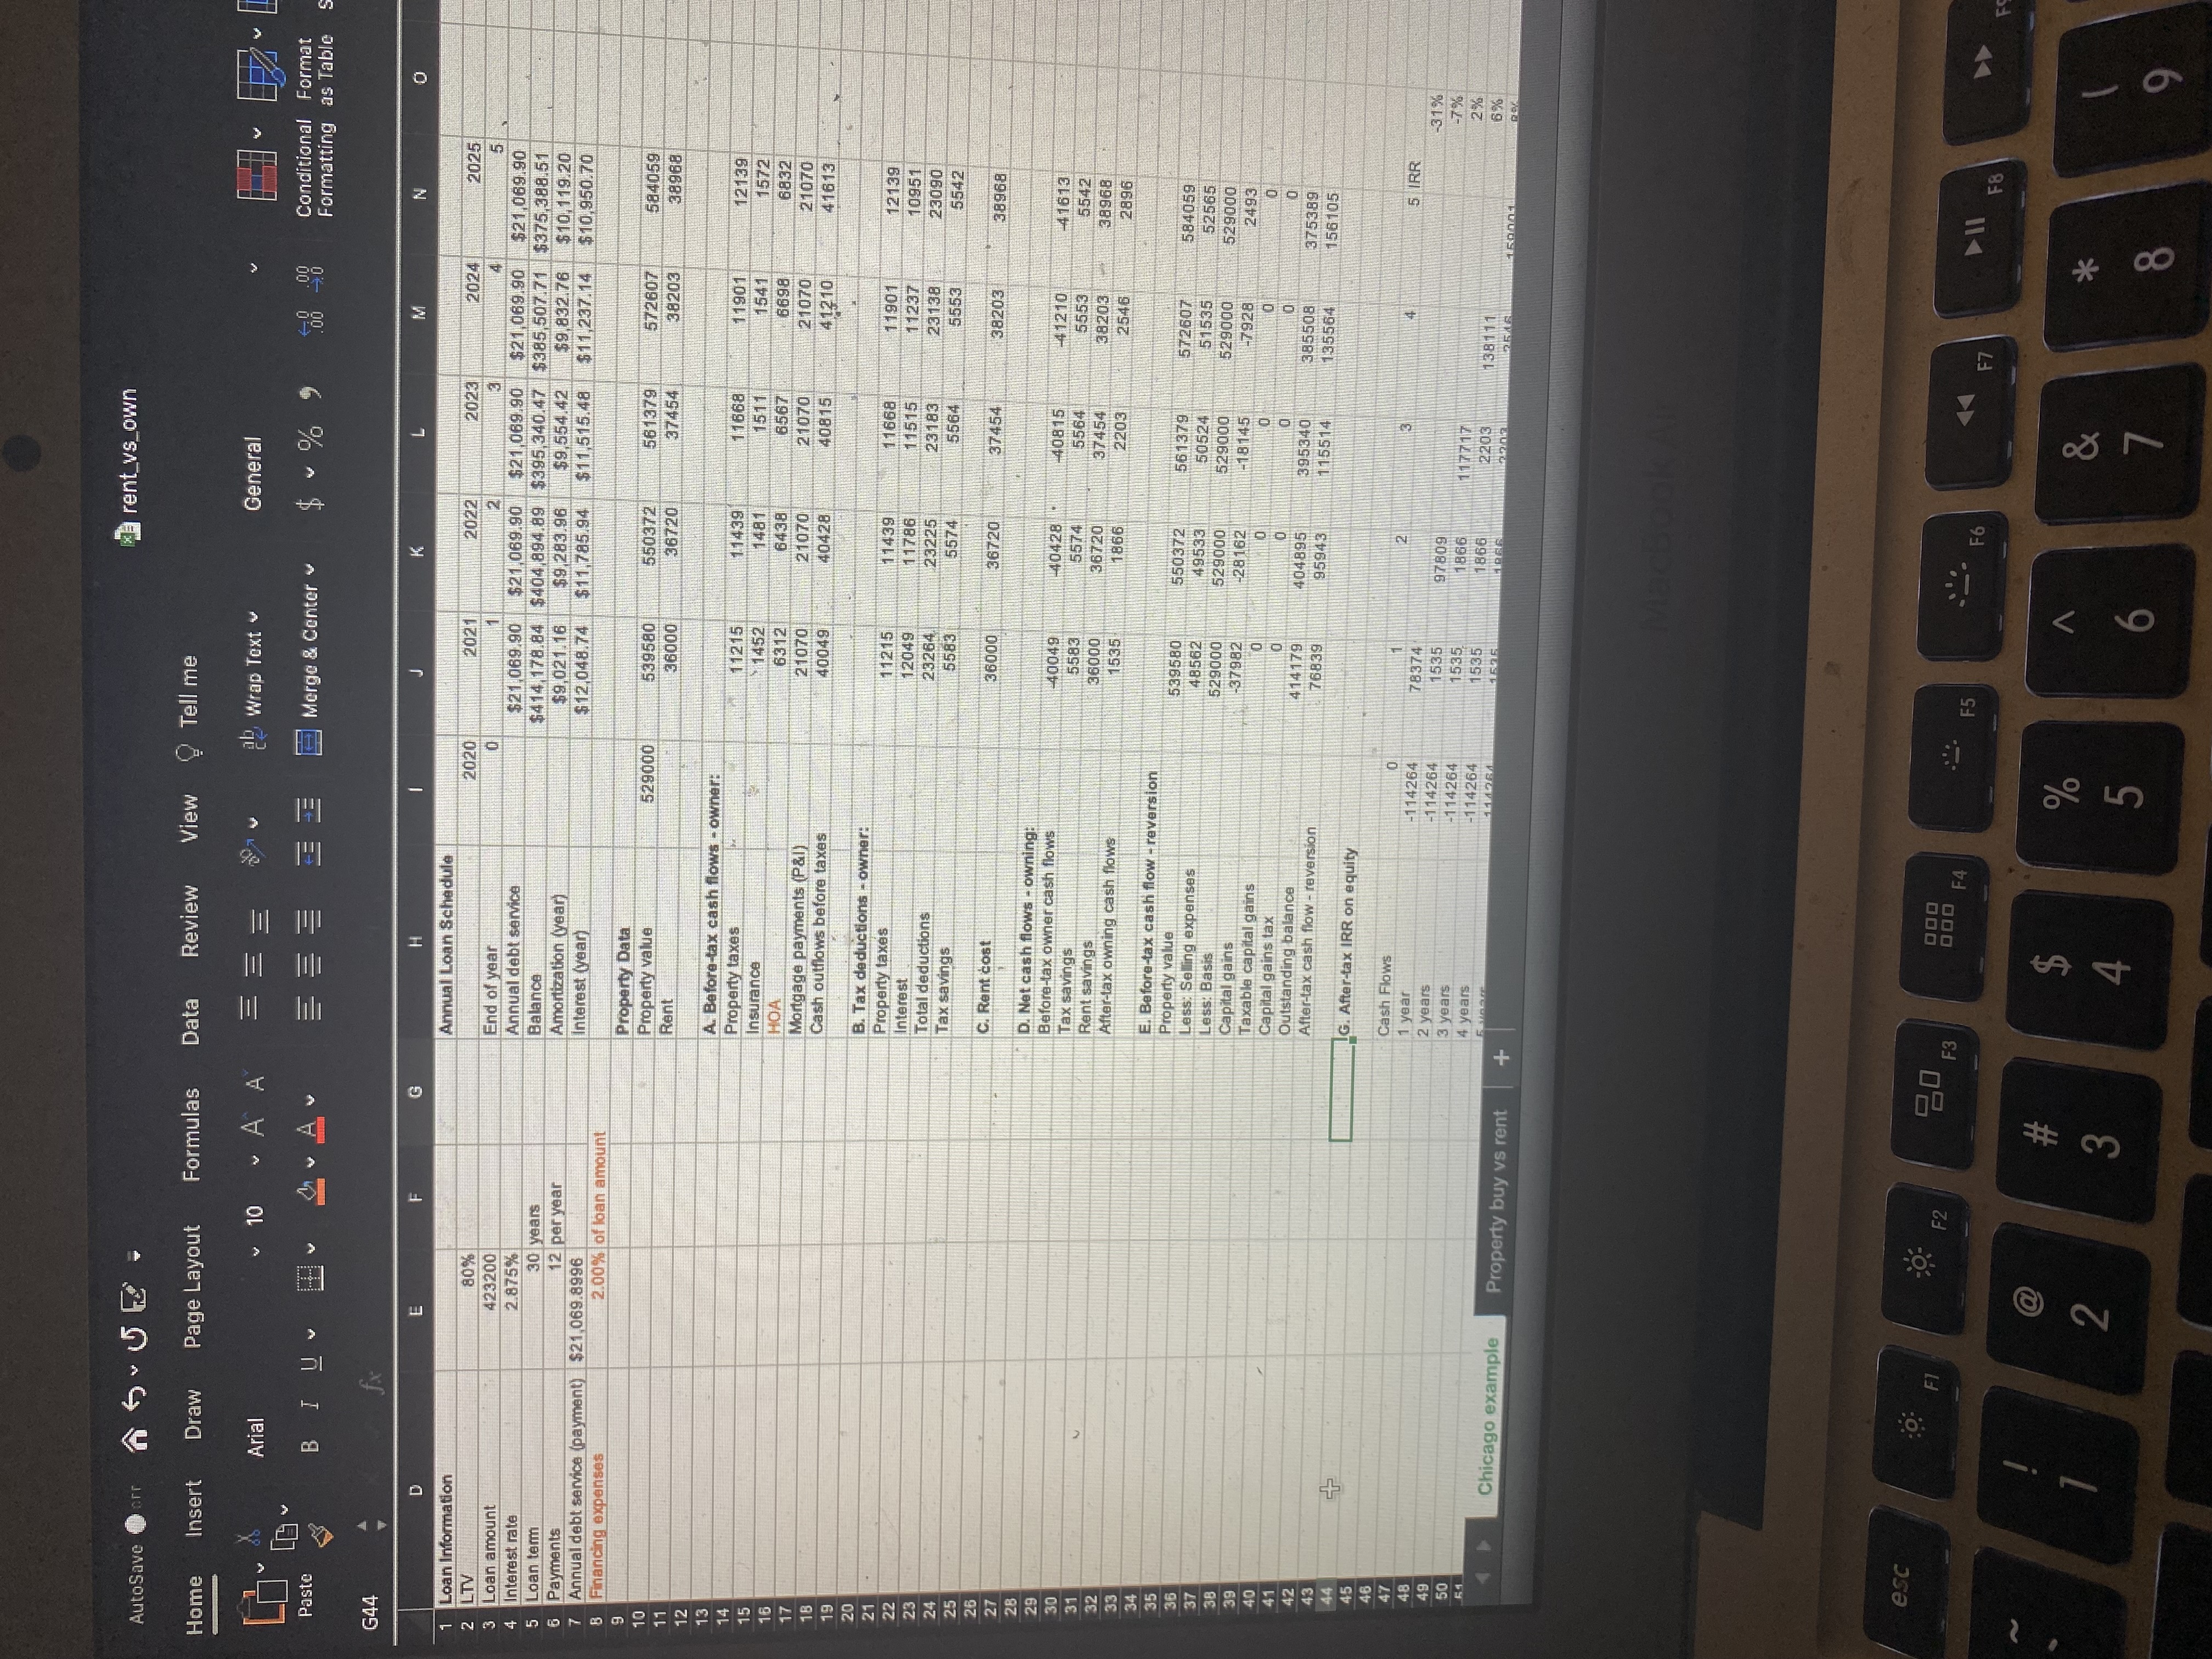
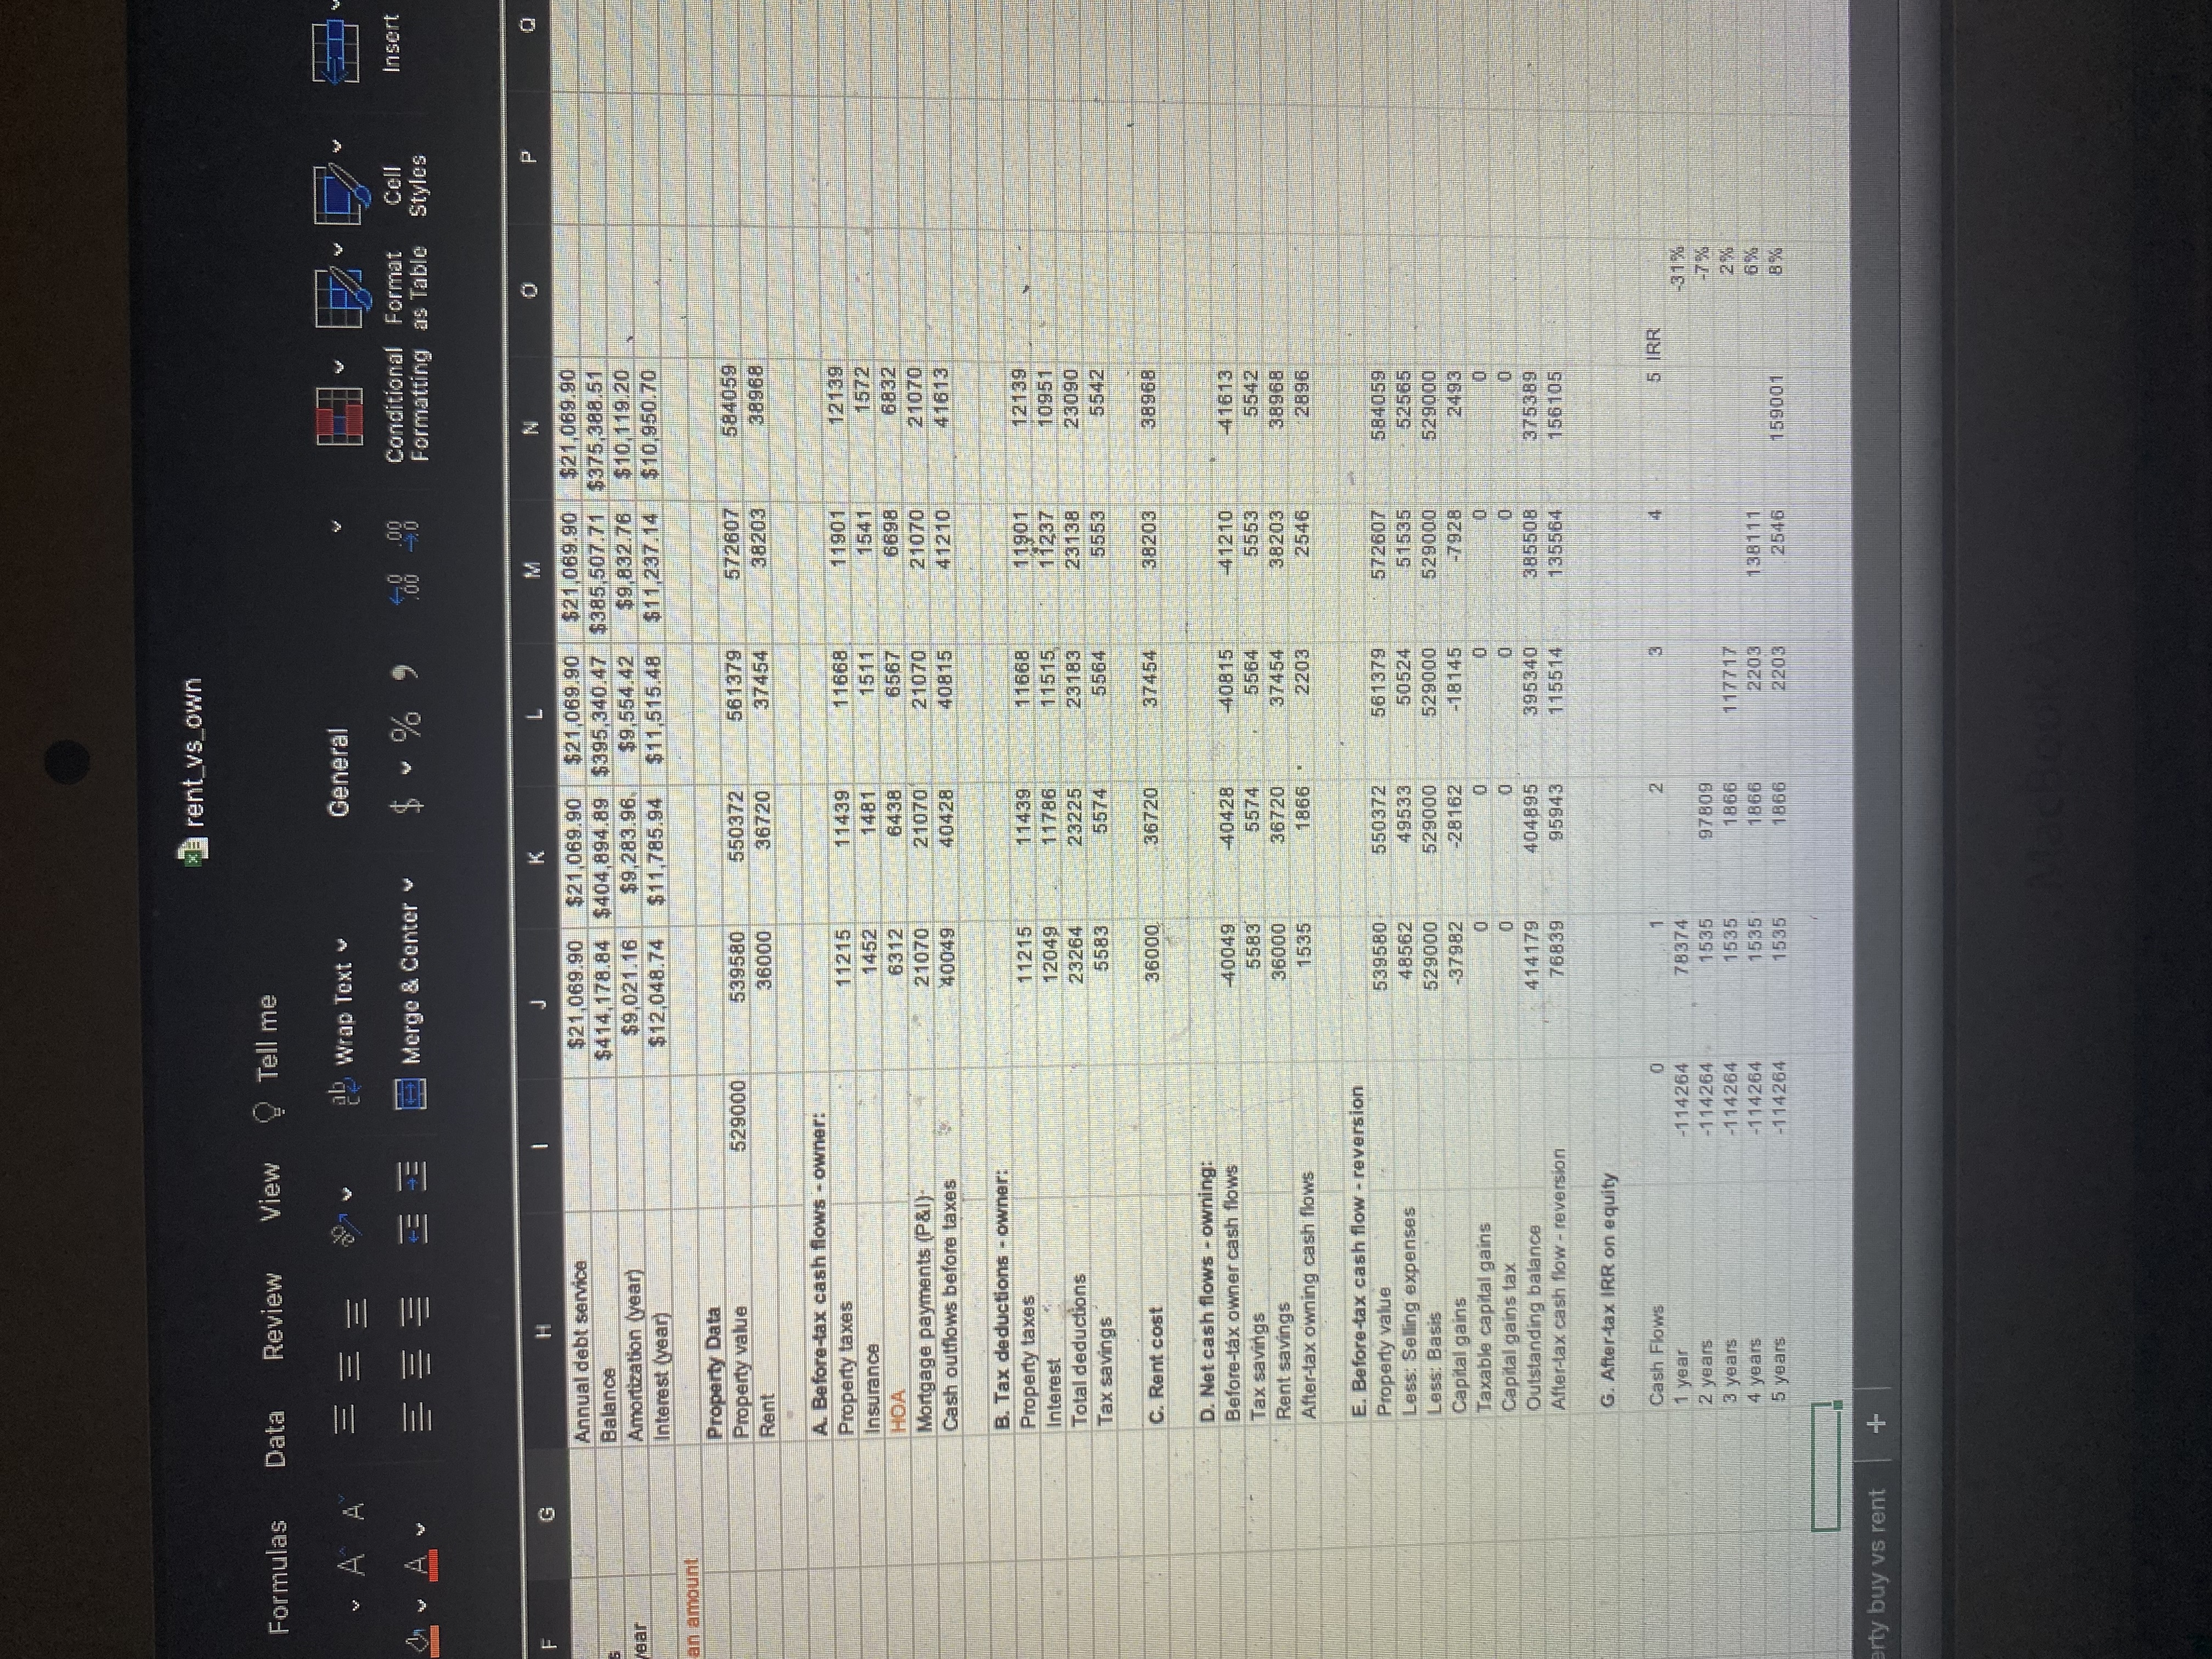
rent vs_own AutoSave Dorr Formulas Data Review View Tell me Home Insert Draw Page Layout ab, Wrap Text v General 10 AA Arial Conditional Format Merge & Center * % Formatting as Table Paste IUV MVAV G44 fx M N O E G D Annual Loan Schedule 2020 2021 2022 2023 2024 2025 Loan Information 3 5 LTV 80% WN - End of year Loan amount 423200 $21.069.90 $21,069.90 $21,069.90 $21,069.90 $21,069.90 Interest rate 2.875% Annual debt service $414 178.84 $404,894 89 $395,340.47 $385,507.71 $375,388.51 30 years Balance Loan term Amortization (year) $9,021.16 $9 283.96 $9,554.42 $9,832 76 $10,119.20 Payments 12 per year $12,048.74 $11,785.94 $11,515.48 $11,237.14 $10,950.70 Annual debt service (payment) $21,069.8996 Interest (year) Financing expenses 2.00% of loan amount Property Data 539580 550372 561379 672607 584059 Property value 529000 38203 38968 36000 6720 37454 Rent A. Before-tax cash flows - owner: 11439 1668 1901 12139 Property taxes 1215 1452 1481 1511 1541 1572 Insurance 6438 6567 6698 68321 6312 HOA 21070 1070 21070 Mortgage payments (P&) 21070 21070 41613 Cash outflows before taxes 40049 40428 40815 1210 B. Tax deductions - owner: Property taxes 11215 11439 11668 1901 12139 11237 10951 Interest 12049 11786 1515 23264 23225 23185 23138 23090 Total deductions 6583 5574 5564 5553 5542 Tax savings C. Rent cost 36000 36720 37454 38203 38968 D. Net cash flows - owning Before-tax owner cash flows 40049 40428 40815 41210 1613 Tax savings 5583 5574 5564 5553 5542 16000 37454 18203 38968 Rent savings 36720 After-tax owning cash flows 1535 1866 2203 2546 2896 E. Before-tax cash flow - reversion Property value 639580 550372 561379 572607 584059 Less: Selling expenses 48562 49533 50524 51535 52565 Less: Basis 2900 629000 629000 529000 29000 Capital gains 37982 -28162 18145 -7928 2493 Taxable capital gains Capital gains tax Outstanding balance 14179 104895 395340 85508 375389 After-tax cash flow - reversion 76839 5943 15514 135564 156105 IG. After-tax IRR on equity Cash Flows 5 IRR 1 year -114264 78374 3 190 2 years -1 14264 1535 87809 - 7% 3 years -1 14264 1535 1866 117717 2 4 years -114264 1535 1866 2203 13871 6% Chicago example Property buy vs rent + esc F2 20 F3 DOO F4 F5 F6 F7 F8 a # LA & 2 3 5 8 91 rent vs own Formulas Data Review View Tell me A ab, Wrap Text v General Merge & Center $ ~ % " Conditional Format Cell Insert Formatting as Table Styles G H K M P Annual debt service $21,069.90 $21,069.90 $21,069.90 $21,069.90 $21,069.90 Balance $414,178.84 $404,894.89 $395,340.47 $385.507.71 $375,388.51 Bar Amortization (year) $9,021.16 $9,283.96. $9,554.42 $9.832.76 $10,119.20 Interest (year) $12,048.74 $11,785.94 $11,515.48 $11,237.14 $10,950.70 an amount Property Data Property value 529000 539580 550372 561379 572607 584059 Rent 36000 36720 37454 38203 38968 A. Before-tax cash flows - owner: Property taxes 11215 11439 11668 11901 12139 Insurance 1452 1481 1511 1541 1572 HOA 6312 6438 6567 6698 6832 Mortgage payments (P&) 21070 21070 21070 21070 21070 Cash outflows before taxes 40049 40428 40815 41210 41613 B. Tax deductions - owner: Property taxes 11215 11439 11668 1 1901 12139 Interest 12049 11786 11515 11237 10951 Total deductions 23264 23225 23183 23138 23090 Tax savings 5583 5574 5564 5553 5542 C. Rent cost 36000 36720 37454 38203 38968 D. Net cash flows - owning: Before-tax owner cash flows 40049 40428 40815 -41210 41613 Tax savings 5583 5574 5564 5553 5542 Rent savings 36000 36720 37454 38203 38968 After-tax owning cash flows 1535 2203 2546 2896 E. Before-tax cash flow - reversion Property value 539580 550372 561379 572607 584059 Less: Selling expenses 48562 49533 50524 51535 52565 Less: Basis 529000 529000 529000 529000 529000 Capital gains -37982 -28162 -18145 -7928 2493 Taxable capital gains 0 Capital gains tax 0 Outstanding balance 414179 404895 395340 385508 375389 After-tax cash flow - reversion 76839 95943 115514 135564 156105 G. After-tax IRR on equity Cash Flows IRR 1 year -114264 78374 -31 75 2 years -114264 1535 97809 3 years -114264 1535 1866 177 4 years -114264 1535 1866 2203 138117 6X 5 years -1 14264 1535 1866 2203 2546 159007 rty buy vs rent +
Step by Step Solution
There are 3 Steps involved in it
1 Expert Approved Answer
Step: 1 Unlock
Question Has Been Solved by an Expert!
Get step-by-step solutions from verified subject matter experts
Step: 2 Unlock
Step: 3 Unlock
Students Have Also Explored These Related Finance Questions!