

Question: Required: Select the data visualization most associated to its type of data analysis (descriptive, diagnostic. predictive, or prescriptive). Type of Data Analysis Data Visualization Scatter
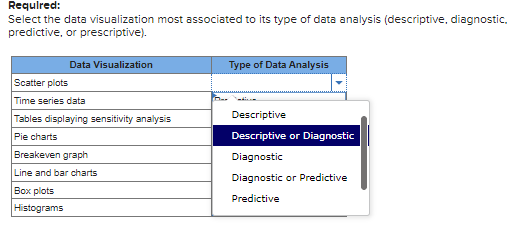
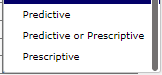
Required: Select the data visualization most associated to its type of data analysis (descriptive, diagnostic. predictive, or prescriptive). Type of Data Analysis Data Visualization Scatter plots Time series data Tables displaying sensitivity analysis Pie charts Breakeven graph Line and bar charts Box plots Histograms Descriptive Descriptive or Diagnostic Diagnostic Diagnostic or Predictive Predictive Predictive Predictive or Prescriptive Prescriptive
Step by Step Solution
There are 3 Steps involved in it
1 Expert Approved Answer
Step: 1 Unlock

Question Has Been Solved by an Expert!
Get step-by-step solutions from verified subject matter experts
Step: 2 Unlock
Step: 3 Unlock