

Question: Requirement 1. Prepare the income statement performance report. Note: The master budget was based on expected sales volume of 65,000 bubble kits. (For accounts with
Requirement 1. Prepare the income statement performance report. Note: The master budget was based on expected sales volume of 65,000 bubble kits. (For accounts with a 0 balance, make sure to enter "0" in the appropriate column. Label each variance as favorable (F) or unfavorable (U). A variance of zero is considered favorable.)
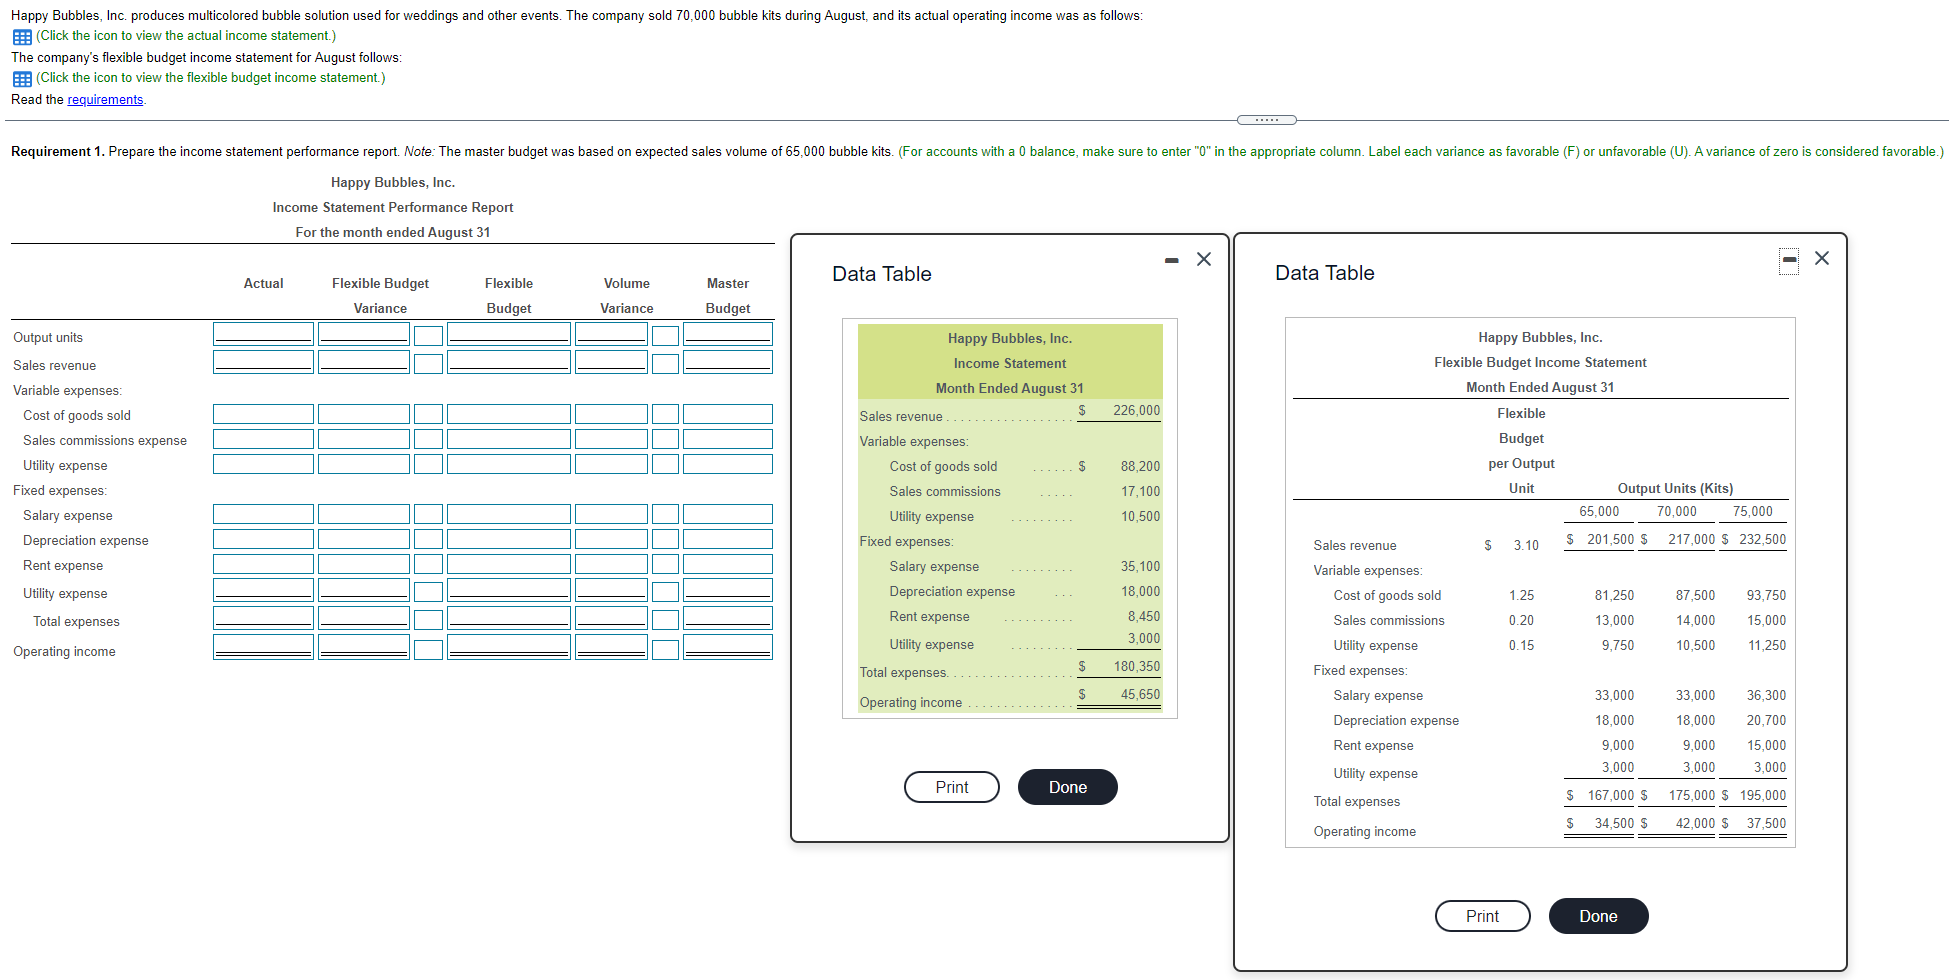
Happy Bubbles, Inc. produces multicolored bubble solution used for weddings and other events. The company sold 70,000 bubble kits during August, and its actual operating income was as follows: (Click the icon to view the actual income statement.) The company's flexible budget income statement for August follows: : (Click the icon to view the flexible budget income statement.) Read the requirements Requirement 1. Prepare the income statement performance report. Note: The master budget was based on expected sales volume of 65,000 bubble kits. (For accounts with a 0 balance, make sure to enter "0" in the appropriate column. Label each variance as favorable (F) or unfavorable (U). A variance of zero is considered favorable.) Happy Bubbles, Inc. Income Statement Performance Report For the month ended August 31 Data Table Data Table Actual Flexible Budget Flexible Volume Master Variance Budget Variance Budget - - Output units Happy Bubbles, Inc. Income Statement Sales revenue 226,000 88,200 Happy Bubbles, Inc. Flexible Budget Income Statement Month Ended August 31 Flexible Budget per Output Unit Output Units (Kits) 65,000 70,000 75,000 Variable expenses Cost of goods sold Sales commissions expense Utility expense Fixed expenses Salary expense Depreciation expense Rent expense Utility expense Total expenses 17,100 Month Ended August 31 $ Sales revenue Variable expenses Cost of goods sold $ Sales commissions Utility expense Fixed expenses Salary expense Depreciation expense Rent expense 10,500 $ 3.10 $ 201,500 $ 217,000 $ 232,500 35,100 1.25 81.250 93,750 18,000 8,450 3,000 0.20 13,000 9.750 87,500 14,000 10,500 15,000 11,250 Utility expense 0.15 Operating income Sales revenue Variable expenses Cost of goods sold Sales commissions Utility expense Fixed expenses: Salary expense Depreciation expense Rent expense Utility expense Total expenses. $ 180,350 $ 45,650 33,000 33,000 36,300 Operating income ............. 18,000 18,000 20,700 9,000 3,000 9,000 3,000 15,000 3,000 Print Done Total expenses $ 167,000 $ 175,000 $ 195,000 $ 34,500 $ Operating income 42,000 $ 37,500 Print Done
Step by Step Solution
There are 3 Steps involved in it

Get step-by-step solutions from verified subject matter experts