

Question: 1a. Compute the current ratios for 2018 and 2017. Begin by selecting the formula to compute the current ratio. Current ratio 1. Compute the
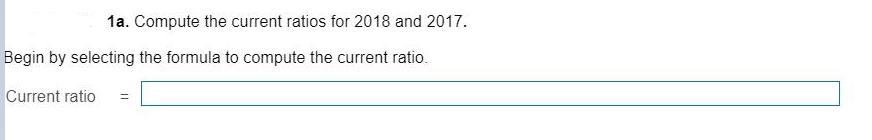
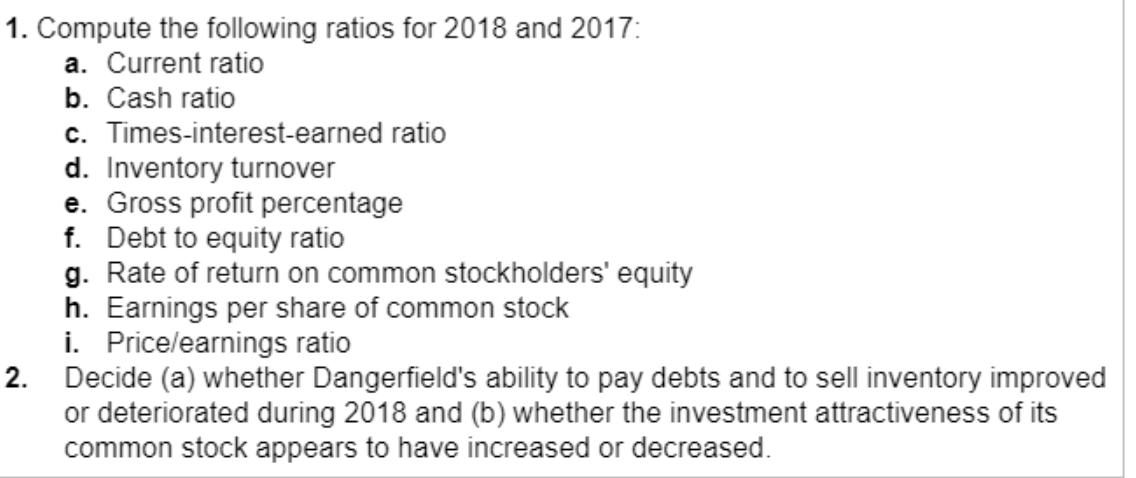

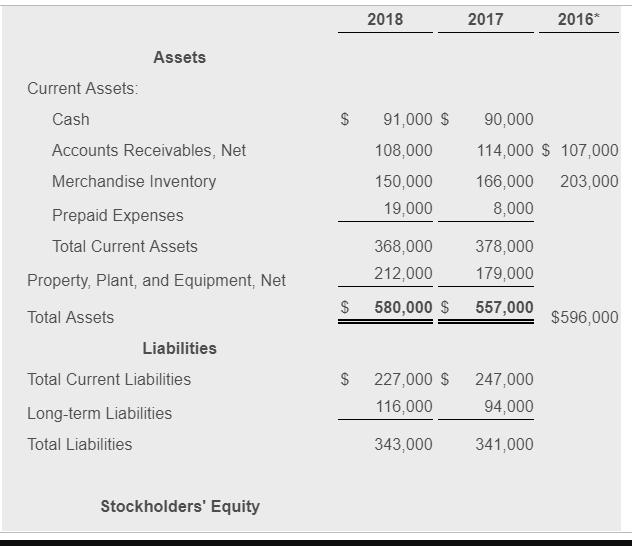
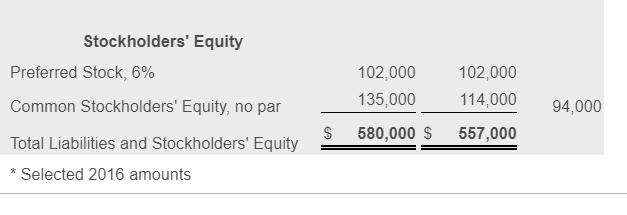
1a. Compute the current ratios for 2018 and 2017. Begin by selecting the formula to compute the current ratio. Current ratio 1. Compute the following ratios for 2018 and 2017: a. Current ratio b. Cash ratio c. Times-interest-earned ratio d. Inventory turnover e. Gross profit percentage f. Debt to equity ratio g. Rate of return on common stockholders' equity h. Earnings per share of common stock i. Price/earnings ratio 2. Decide (a) whether Dangerfield's ability to pay debts and to sell inventory improved or deteriorated during 2018 and (b) whether the investment attractiveness of its common stock appears to have increased or decreased. Dangerfield, Inc. Comparative Income Statement Years Ended December 31, 2018 and 2017 2018 2017 Net Sales Revenue $ 467,000 $ 425,000 Cost of Goods Sold 238,000 216,000 Gross Profit 229,000 209,000 Operating Expenses 134,000 132,000 Income From Operations 95,000 77,000 Interest Expense 13,000 14,000 Income Before Income Tax 82,000 63,000 Income Tax Expense 20,000 26,000 62,000 $ 37,000 Net Income %24 2018 2017 2016* Assets Current Assets: Cash 91,000 $ 90,000 Accounts Receivables, Net 108,000 114,000 $ 107,000 Merchandise Inventory 150,000 166,000 203,000 19,000 8,000 Prepaid Expenses Total Current Assets 368,000 378,000 Property, Plant, and Equipment, Net 212,000 179,000 580,000 $ 557,000 Total Assets $596,000 Liabilities Total Current Liabilities 227,000 $ 247,000 116,000 94,000 Long-term Liabilities Total Liabilities 343,000 341,000 Stockholders' Equity %24 Stockholders' Equity Preferred Stock, 6% 102,000 102,000 Common Stockholders' Equity, no par 135,000 114,000 94,000 580,000 S 557,000 Total Liabilities and Stockholders' Equity Selected 2016 amounts 1a. Compute the current ratios for 2018 and 2017. Begin by selecting the formula to compute the current ratio. Current ratio 1. Compute the following ratios for 2018 and 2017: a. Current ratio b. Cash ratio c. Times-interest-earned ratio d. Inventory turnover e. Gross profit percentage f. Debt to equity ratio g. Rate of return on common stockholders' equity h. Earnings per share of common stock i. Price/earnings ratio 2. Decide (a) whether Dangerfield's ability to pay debts and to sell inventory improved or deteriorated during 2018 and (b) whether the investment attractiveness of its common stock appears to have increased or decreased. Dangerfield, Inc. Comparative Income Statement Years Ended December 31, 2018 and 2017 2018 2017 Net Sales Revenue $ 467,000 $ 425,000 Cost of Goods Sold 238,000 216,000 Gross Profit 229,000 209,000 Operating Expenses 134,000 132,000 Income From Operations 95,000 77,000 Interest Expense 13,000 14,000 Income Before Income Tax 82,000 63,000 Income Tax Expense 20,000 26,000 62,000 $ 37,000 Net Income %24 2018 2017 2016* Assets Current Assets: Cash 91,000 $ 90,000 Accounts Receivables, Net 108,000 114,000 $ 107,000 Merchandise Inventory 150,000 166,000 203,000 19,000 8,000 Prepaid Expenses Total Current Assets 368,000 378,000 Property, Plant, and Equipment, Net 212,000 179,000 580,000 $ 557,000 Total Assets $596,000 Liabilities Total Current Liabilities 227,000 $ 247,000 116,000 94,000 Long-term Liabilities Total Liabilities 343,000 341,000 Stockholders' Equity %24 Stockholders' Equity Preferred Stock, 6% 102,000 102,000 Common Stockholders' Equity, no par 135,000 114,000 94,000 580,000 S 557,000 Total Liabilities and Stockholders' Equity Selected 2016 amounts 1a. Compute the current ratios for 2018 and 2017. Begin by selecting the formula to compute the current ratio. Current ratio 1. Compute the following ratios for 2018 and 2017: a. Current ratio b. Cash ratio c. Times-interest-earned ratio d. Inventory turnover e. Gross profit percentage f. Debt to equity ratio g. Rate of return on common stockholders' equity h. Earnings per share of common stock i. Price/earnings ratio 2. Decide (a) whether Dangerfield's ability to pay debts and to sell inventory improved or deteriorated during 2018 and (b) whether the investment attractiveness of its common stock appears to have increased or decreased. Dangerfield, Inc. Comparative Income Statement Years Ended December 31, 2018 and 2017 2018 2017 Net Sales Revenue $ 467,000 $ 425,000 Cost of Goods Sold 238,000 216,000 Gross Profit 229,000 209,000 Operating Expenses 134,000 132,000 Income From Operations 95,000 77,000 Interest Expense 13,000 14,000 Income Before Income Tax 82,000 63,000 Income Tax Expense 20,000 26,000 62,000 $ 37,000 Net Income %24 2018 2017 2016* Assets Current Assets: Cash 91,000 $ 90,000 Accounts Receivables, Net 108,000 114,000 $ 107,000 Merchandise Inventory 150,000 166,000 203,000 19,000 8,000 Prepaid Expenses Total Current Assets 368,000 378,000 Property, Plant, and Equipment, Net 212,000 179,000 580,000 $ 557,000 Total Assets $596,000 Liabilities Total Current Liabilities 227,000 $ 247,000 116,000 94,000 Long-term Liabilities Total Liabilities 343,000 341,000 Stockholders' Equity %24 Stockholders' Equity Preferred Stock, 6% 102,000 102,000 Common Stockholders' Equity, no par 135,000 114,000 94,000 580,000 S 557,000 Total Liabilities and Stockholders' Equity Selected 2016 amounts 1a. Compute the current ratios for 2018 and 2017. Begin by selecting the formula to compute the current ratio. Current ratio 1. Compute the following ratios for 2018 and 2017: a. Current ratio b. Cash ratio c. Times-interest-earned ratio d. Inventory turnover e. Gross profit percentage f. Debt to equity ratio g. Rate of return on common stockholders' equity h. Earnings per share of common stock i. Price/earnings ratio 2. Decide (a) whether Dangerfield's ability to pay debts and to sell inventory improved or deteriorated during 2018 and (b) whether the investment attractiveness of its common stock appears to have increased or decreased. Dangerfield, Inc. Comparative Income Statement Years Ended December 31, 2018 and 2017 2018 2017 Net Sales Revenue $ 467,000 $ 425,000 Cost of Goods Sold 238,000 216,000 Gross Profit 229,000 209,000 Operating Expenses 134,000 132,000 Income From Operations 95,000 77,000 Interest Expense 13,000 14,000 Income Before Income Tax 82,000 63,000 Income Tax Expense 20,000 26,000 62,000 $ 37,000 Net Income %24 2018 2017 2016* Assets Current Assets: Cash 91,000 $ 90,000 Accounts Receivables, Net 108,000 114,000 $ 107,000 Merchandise Inventory 150,000 166,000 203,000 19,000 8,000 Prepaid Expenses Total Current Assets 368,000 378,000 Property, Plant, and Equipment, Net 212,000 179,000 580,000 $ 557,000 Total Assets $596,000 Liabilities Total Current Liabilities 227,000 $ 247,000 116,000 94,000 Long-term Liabilities Total Liabilities 343,000 341,000 Stockholders' Equity %24 Stockholders' Equity Preferred Stock, 6% 102,000 102,000 Common Stockholders' Equity, no par 135,000 114,000 94,000 580,000 S 557,000 Total Liabilities and Stockholders' Equity Selected 2016 amounts
Step by Step Solution
3.52 Rating (166 Votes )
There are 3 Steps involved in it
Answer Solution Dangerfield Statement of Earnings 2018 2017 Sales 46700000 42500000 Cost of goods sold 23800000 21600000 Gross Profit 22900000 2090000... View full answer

Get step-by-step solutions from verified subject matter experts