

Question: Requirements Which depreciation method does Target Corporation use for reporting in the financial statements? What type of depreciation method does the company probably use for
Requirements
- Which depreciation method does Target Corporation use for reporting in the financial statements? What type of depreciation method does the company probably use for income tax purposes?
- What was the amount of depreciation and amortization expense for the year ending February 1, 2020?
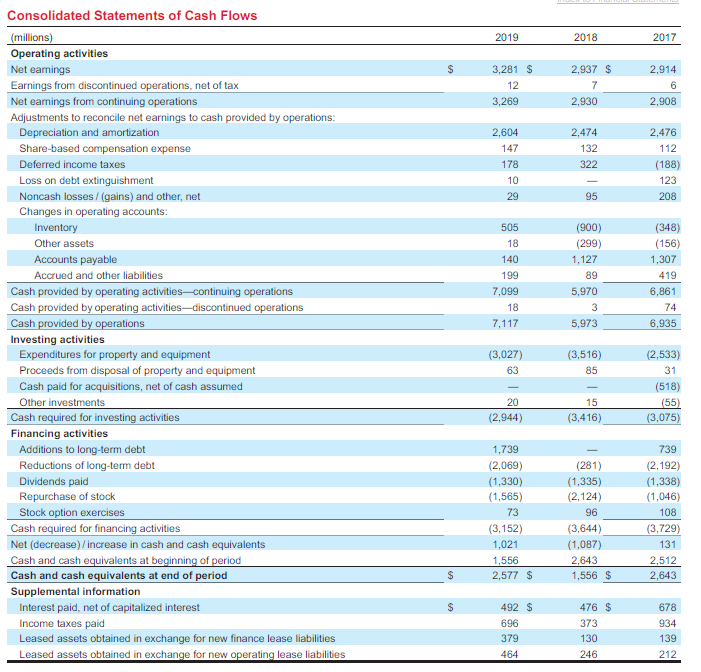
- The statement of cash flows reports the cash purchases of property, plant, and equipment. How much were Targets additions to property, plant, and equipment during the year ending February 1, 2020? Did Target record any proceeds from the sale of property, plant, and equipment?
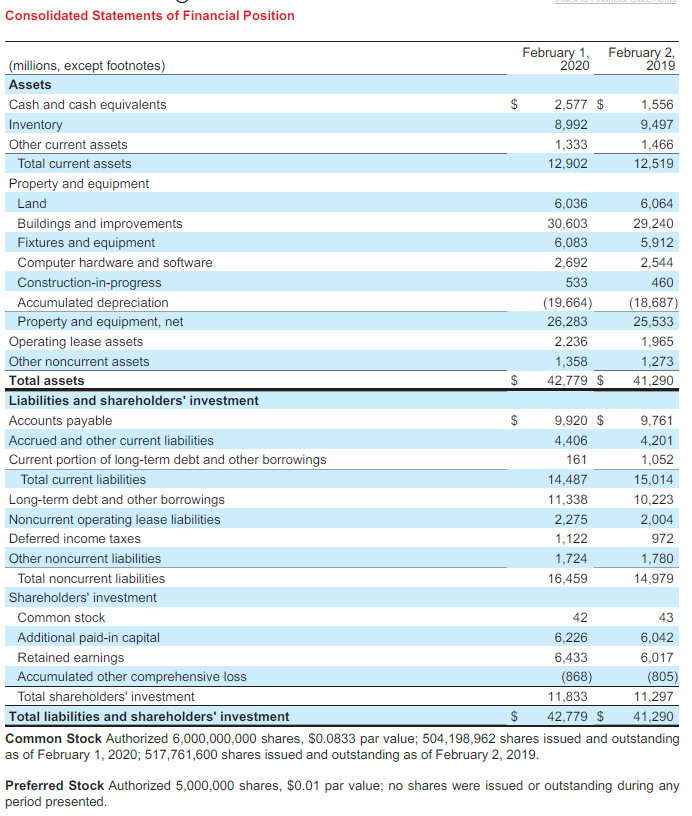
- What was the amount of accumulated depreciation on February 1, 2020? What was the net book value of property, plant, and equipment for Target as of February 1, 2020?
- Compute Targets asset turnover ratio for the year ending February 1, 2020. Round to two decimal places. How does Targets ratio compare with that of Kohls Corporation?
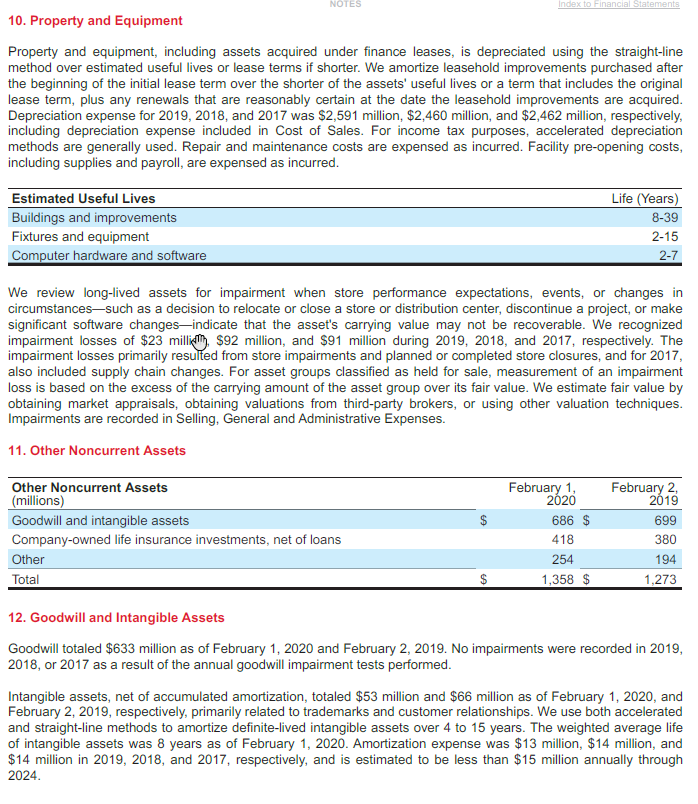
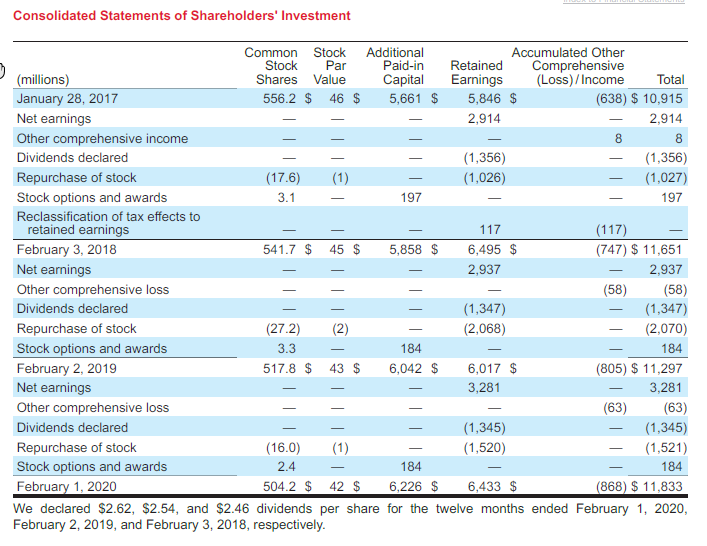
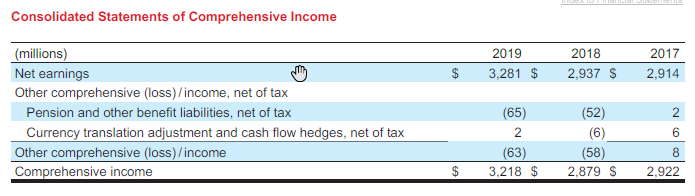
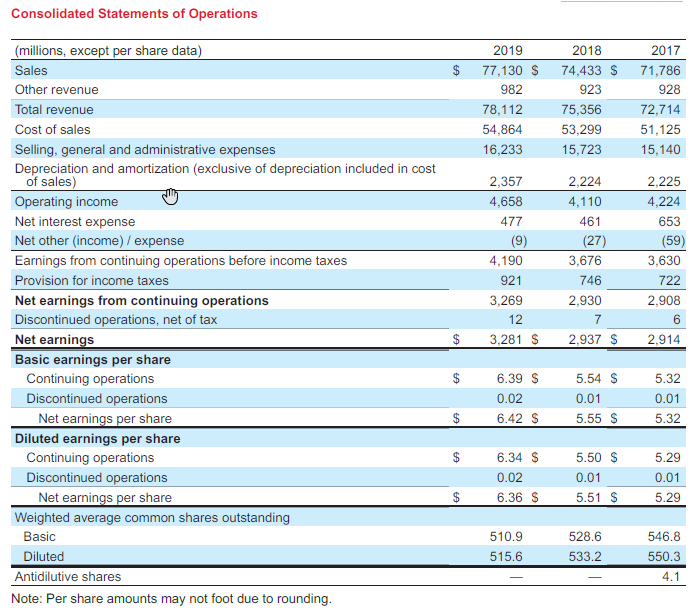
NOTES Index to Financial Statements 10. Property and Equipment Property and equipment, including assets acquired under finance leases, is depreciated using the straight-line method over estimated useful lives or lease terms if shorter. We amortize leasehold improvements purchased after the beginning of the initial lease term over the shorter of the assets' useful lives or a term that includes the original lease term, plus any renewals that are reasonably certain at the date the leasehold improvements are acquired. Depreciation expense for 2019, 2018, and 2017 was $2,591 million, $2,460 million, and $2,462 million, respectively, including depreciation expense included in Cost of Sales. For income tax purposes, accelerated depreciation methods are generally used. Repair and maintenance costs are expensed as incurred. Facility pre-opening costs, including supplies and payroll, are expensed as incurred. Estimated Useful Lives Buildings and improvements Fixtures and equipment Computer hardware and software Life (Years) 8-39 2-15 2-7 We review long-lived assets for impairment when store performance expectations, events, or changes in circumstancessuch as a decision to relocate or close a store or distribution center, discontinue a project, or make significant software changes-indicate that the asset's carrying value may not be recoverable. We recognized impairment losses of $23 million $92 million, and $91 million during 2019, 2018, and 2017, respectively. The impairment losses primarily resulted from store impairments and planned or completed store closures, and for 2017, also included supply chain changes. For asset groups classified as held for sale, measurement of an impairment loss is based on the excess of the carrying amount of the asset group over its fair value. We estimate fair value by obtaining market appraisals, obtaining valuations from third-party brokers, or using other valuation techniques. Impairments are recorded in Selling, General and Administrative Expenses. 11. Other Noncurrent Assets Other Noncurrent Assets (millions) Goodwill and intangible assets Company-owned life insurance investments, net of loans Other Total February 1, 2020 686 $ 418 254 1,358 $ February 2 2019 699 380 194 1,273 12. Goodwill and Intangible Assets Goodwill totaled $633 million as of February 1, 2020 and February 2, 2019. No impairments were recorded in 2019, 2018, or 2017 as a result of the annual goodwill impairment tests performed. Intangible assets, net of accumulated amortization, totaled $53 million and $66 million as of February 1, 2020, and February 2, 2019, respectively, primarily related to trademarks and customer relationships. We use both accelerated and straight-line methods to amortize definite-lived intangible assets over 4 to 15 years. The weighted average life of intangible assets was 8 years as of February 1, 2020. Amortization expense was $13 million, $14 million, and $14 million in 2019, 2018, and 2017, respectively, and is estimated to be less than $15 million annually through 2024. Consolidated Statements of Shareholders' Investment 3 Common Stock Additional Accumulated Other Stock Par Paid-in Retained Comprehensive (millions) Shares Value Capital Earnings (Loss)/Income Total January 28, 2017 556.2 $ 46 $ 5,661 $ 5,846 $ (638) $ 10,915 Net earnings 2,914 2,914 Other comprehensive income 8 8 Dividends declared (1,356) (1,356) Repurchase of stock (17.6) (1) (1,026) (1,027) Stock options and awards 3.1 197 197 Reclassification of tax effects to retained earnings 117 (117) February 3, 2018 541.7 $ 45 $ 5,858 $ 6,495 $ (747) $ 11,651 Net earnings 2,937 2,937 Other comprehensive loss (58) (58) Dividends declared (1,347) (1,347) Repurchase of stock (272) (2) (2,068) (2,070) Stock options and awards 3.3 184 184 February 2, 2019 517.8 $ 43 $ 6,042 $ 6,017 $ (805) $ 11,297 Net earnings 3,281 3,281 Other comprehensive loss (63) (63) Dividends declared (1,345) (1,345) Repurchase of stock (16.0) (1) (1,520) (1,521) Stock options and awards 2.4 184 184 February 1, 2020 504.2 $ 42 $ 6,226 $ 6,433 $ (868) $ 11,833 We declared $2.62, $2.54, and $2.46 dividends per share for the twelve months ended February 1, 2020, February 2, 2019, and February 3, 2018, respectively. Tall III AT 2019 2018 2017 s 3,281 $ 12 3,269 2,937 $ 7 2,930 2,914 6 2,908 2,604 147 178 10 29 2,474 132 322 2,476 112 (188) 123 208 95 505 18 140 199 7,099 18 7,117 (900) (299) 1,127 89 5,970 3 5,973 (348) (156) 1,307 419 6,861 74 6,935 Consolidated Statements of Cash Flows (millions) Operating activities Net earnings Earnings from discontinued operations, net of tax Net earnings from continuing operations Adjustments to reconcile net earnings to cash provided by operations: Depreciation and amortization Share-based compensation expense Deferred income taxes Loss on debt extinguishment Noncash losses/(gains) and other, net Changes in operating accounts: Inventory Other assets Accounts payable Accrued and other liabilities Cash provided by operating activities-continuing operations Cash provided by operating activitiesdiscontinued operations Cash provided by operations Investing activities Expenditures for property and equipment Proceeds from disposal of property and equipment Cash paid for acquisitions, net of cash assumed Other investments Cash required for investing activities Financing activities Additions to long-term debt Reductions of long-term debt Dividends paid Repurchase of stock Stock option exercises Cash required for financing activities Net (decrease), increase in cash and cash equivalents Cash and cash equivalents at beginning of period Cash and cash equivalents at end of period Supplemental information Interest paid, net of capitalized interest Income taxes paid Leased assets obtained in exchange for new finance lease liabilities Leased assets obtained in exchange for new operating lease liabilities (3,027) 63 (3,516) 85 (2,533) 31 (518) (55) (3,075) 20 (2,944) 15 (3,416) 1,739 (2,069) (1,330) (1,565) 73 (3,152) 1,021 1,556 2,577 $ (281) (1,335) (2,124) 96 (3,644) (1,087) 2,643 1,556 $ 739 (2,192) (1,338) (1.046 108 (3,729) 131 2,512 2.643 $ 492 $ 696 379 476 $ 373 130 246 678 934 139 212 464 Consolidated Statements of Financial Position $ February 1, February 2 (millions, except footnotes) 2020 2019 Assets Cash and cash equivalents 2,577 $ 1,556 Inventory 8,992 9,497 Other current assets 1,333 1,466 Total current assets 12,902 12,519 Property and equipment Land 6,036 6,064 Buildings and improvements 30,603 29,240 Fixtures and equipment 6,083 5,912 Computer hardware and software 2,692 2,544 Construction-in-progress 533 460 Accumulated depreciation (19,664) (18,687) Property and equipment, net 26,283 25,533 Operating lease assets 2,236 1,965 Other noncurrent assets 1,358 1,273 Total assets $ 42,779 $ 41,290 Liabilities and shareholders' investment Accounts payable 9,920 $ 9,761 Accrued and other current liabilities 4,406 4,201 Current portion of long-term debt and other borrowings 161 1,052 Total current liabilities 14,487 15,014 Long-term debt and other borrowings 11,338 10,223 Noncurrent operating lease liabilities 2,275 2,004 Deferred income taxes 1,122 972 Other noncurrent liabilities 1,724 1,780 Total noncurrent liabilities 16,459 14,979 Shareholders' investment Common stock 42 43 Additional paid-in capital 6,226 6,042 Retained earnings 6,433 6,017 Accumulated other comprehensive loss (868) (805) Total shareholders' investment 11,833 11,297 Total liabilities and shareholders' investment $ 42,779 $ 41,290 Common Stock Authorized 6,000,000,000 shares, $0.0833 par value; 504,198,962 shares issued and outstanding as of February 1, 2020; 517,761,600 shares issued and outstanding as of February 2, 2019. Preferred Stock Authorized 5,000,000 shares, $0.01 par value; no shares were issued or outstanding during any period presented. Consolidated Statements of Comprehensive Income 2019 3,281 $ 2018 2,937 $ 2017 2,914 (millions) Net earnings Other comprehensive (loss)/income, net of tax Pension and other benefit liabilities, net of tax Currency translation adjustment and cash flow hedges, net of tax Other comprehensive (loss)/income Comprehensive income 2 (65) 2 (63) 3,218 $ (52) (6) (58) 2,879 $ 6 8 2,922 Consolidated Statements of Operations 2017 $ 2019 77,130 $ 982 78,112 54,864 16,233 2018 74,433 $ 923 75,356 53,299 15,723 71,786 928 72,714 51,125 15,140 2.225 (millions, except per share data) Sales Other revenue Total revenue Cost of sales Selling, general and administrative expenses Depreciation and amortization (exclusive of depreciation included in cost of sales) Operating income Net interest expense Net other (income) / expense Earnings from continuing operations before income taxes Provision for income taxes Net earnings from continuing operations Discontinued operations, net of tax Net earnings Basic earnings per share Continuing operations Discontinued operations Net earnings per share Diluted earnings per share Continuing operations Discontinued operations Net earnings per share Weighted average common shares outstanding Basic Diluted Antidilutive shares Note: Per share amounts may not foot due to rounding. 2,357 4,658 477 (9) 4,190 921 3,269 12 3,281 $ 2,224 4,110 461 (27) 3,676 746 2,930 7 2,937 $ 4,224 653 (59) 3,630 722 2,908 6 2,914 $ 6.39 $ 0.02 6.42 $ 5.54 $ 0.01 5.55 S 5.32 0.01 5.32 $ 6.34 $ 0.02 6.36 $ 5.50 $ 0.01 5.51 $ 5.29 0.01 5.29 510.9 515.6 528.6 533.2 546.8 550.3 4.1 NOTES Index to Financial Statements 10. Property and Equipment Property and equipment, including assets acquired under finance leases, is depreciated using the straight-line method over estimated useful lives or lease terms if shorter. We amortize leasehold improvements purchased after the beginning of the initial lease term over the shorter of the assets' useful lives or a term that includes the original lease term, plus any renewals that are reasonably certain at the date the leasehold improvements are acquired. Depreciation expense for 2019, 2018, and 2017 was $2,591 million, $2,460 million, and $2,462 million, respectively, including depreciation expense included in Cost of Sales. For income tax purposes, accelerated depreciation methods are generally used. Repair and maintenance costs are expensed as incurred. Facility pre-opening costs, including supplies and payroll, are expensed as incurred. Estimated Useful Lives Buildings and improvements Fixtures and equipment Computer hardware and software Life (Years) 8-39 2-15 2-7 We review long-lived assets for impairment when store performance expectations, events, or changes in circumstancessuch as a decision to relocate or close a store or distribution center, discontinue a project, or make significant software changes-indicate that the asset's carrying value may not be recoverable. We recognized impairment losses of $23 million $92 million, and $91 million during 2019, 2018, and 2017, respectively. The impairment losses primarily resulted from store impairments and planned or completed store closures, and for 2017, also included supply chain changes. For asset groups classified as held for sale, measurement of an impairment loss is based on the excess of the carrying amount of the asset group over its fair value. We estimate fair value by obtaining market appraisals, obtaining valuations from third-party brokers, or using other valuation techniques. Impairments are recorded in Selling, General and Administrative Expenses. 11. Other Noncurrent Assets Other Noncurrent Assets (millions) Goodwill and intangible assets Company-owned life insurance investments, net of loans Other Total February 1, 2020 686 $ 418 254 1,358 $ February 2 2019 699 380 194 1,273 12. Goodwill and Intangible Assets Goodwill totaled $633 million as of February 1, 2020 and February 2, 2019. No impairments were recorded in 2019, 2018, or 2017 as a result of the annual goodwill impairment tests performed. Intangible assets, net of accumulated amortization, totaled $53 million and $66 million as of February 1, 2020, and February 2, 2019, respectively, primarily related to trademarks and customer relationships. We use both accelerated and straight-line methods to amortize definite-lived intangible assets over 4 to 15 years. The weighted average life of intangible assets was 8 years as of February 1, 2020. Amortization expense was $13 million, $14 million, and $14 million in 2019, 2018, and 2017, respectively, and is estimated to be less than $15 million annually through 2024. Consolidated Statements of Shareholders' Investment 3 Common Stock Additional Accumulated Other Stock Par Paid-in Retained Comprehensive (millions) Shares Value Capital Earnings (Loss)/Income Total January 28, 2017 556.2 $ 46 $ 5,661 $ 5,846 $ (638) $ 10,915 Net earnings 2,914 2,914 Other comprehensive income 8 8 Dividends declared (1,356) (1,356) Repurchase of stock (17.6) (1) (1,026) (1,027) Stock options and awards 3.1 197 197 Reclassification of tax effects to retained earnings 117 (117) February 3, 2018 541.7 $ 45 $ 5,858 $ 6,495 $ (747) $ 11,651 Net earnings 2,937 2,937 Other comprehensive loss (58) (58) Dividends declared (1,347) (1,347) Repurchase of stock (272) (2) (2,068) (2,070) Stock options and awards 3.3 184 184 February 2, 2019 517.8 $ 43 $ 6,042 $ 6,017 $ (805) $ 11,297 Net earnings 3,281 3,281 Other comprehensive loss (63) (63) Dividends declared (1,345) (1,345) Repurchase of stock (16.0) (1) (1,520) (1,521) Stock options and awards 2.4 184 184 February 1, 2020 504.2 $ 42 $ 6,226 $ 6,433 $ (868) $ 11,833 We declared $2.62, $2.54, and $2.46 dividends per share for the twelve months ended February 1, 2020, February 2, 2019, and February 3, 2018, respectively. Tall III AT 2019 2018 2017 s 3,281 $ 12 3,269 2,937 $ 7 2,930 2,914 6 2,908 2,604 147 178 10 29 2,474 132 322 2,476 112 (188) 123 208 95 505 18 140 199 7,099 18 7,117 (900) (299) 1,127 89 5,970 3 5,973 (348) (156) 1,307 419 6,861 74 6,935 Consolidated Statements of Cash Flows (millions) Operating activities Net earnings Earnings from discontinued operations, net of tax Net earnings from continuing operations Adjustments to reconcile net earnings to cash provided by operations: Depreciation and amortization Share-based compensation expense Deferred income taxes Loss on debt extinguishment Noncash losses/(gains) and other, net Changes in operating accounts: Inventory Other assets Accounts payable Accrued and other liabilities Cash provided by operating activities-continuing operations Cash provided by operating activitiesdiscontinued operations Cash provided by operations Investing activities Expenditures for property and equipment Proceeds from disposal of property and equipment Cash paid for acquisitions, net of cash assumed Other investments Cash required for investing activities Financing activities Additions to long-term debt Reductions of long-term debt Dividends paid Repurchase of stock Stock option exercises Cash required for financing activities Net (decrease), increase in cash and cash equivalents Cash and cash equivalents at beginning of period Cash and cash equivalents at end of period Supplemental information Interest paid, net of capitalized interest Income taxes paid Leased assets obtained in exchange for new finance lease liabilities Leased assets obtained in exchange for new operating lease liabilities (3,027) 63 (3,516) 85 (2,533) 31 (518) (55) (3,075) 20 (2,944) 15 (3,416) 1,739 (2,069) (1,330) (1,565) 73 (3,152) 1,021 1,556 2,577 $ (281) (1,335) (2,124) 96 (3,644) (1,087) 2,643 1,556 $ 739 (2,192) (1,338) (1.046 108 (3,729) 131 2,512 2.643 $ 492 $ 696 379 476 $ 373 130 246 678 934 139 212 464 Consolidated Statements of Financial Position $ February 1, February 2 (millions, except footnotes) 2020 2019 Assets Cash and cash equivalents 2,577 $ 1,556 Inventory 8,992 9,497 Other current assets 1,333 1,466 Total current assets 12,902 12,519 Property and equipment Land 6,036 6,064 Buildings and improvements 30,603 29,240 Fixtures and equipment 6,083 5,912 Computer hardware and software 2,692 2,544 Construction-in-progress 533 460 Accumulated depreciation (19,664) (18,687) Property and equipment, net 26,283 25,533 Operating lease assets 2,236 1,965 Other noncurrent assets 1,358 1,273 Total assets $ 42,779 $ 41,290 Liabilities and shareholders' investment Accounts payable 9,920 $ 9,761 Accrued and other current liabilities 4,406 4,201 Current portion of long-term debt and other borrowings 161 1,052 Total current liabilities 14,487 15,014 Long-term debt and other borrowings 11,338 10,223 Noncurrent operating lease liabilities 2,275 2,004 Deferred income taxes 1,122 972 Other noncurrent liabilities 1,724 1,780 Total noncurrent liabilities 16,459 14,979 Shareholders' investment Common stock 42 43 Additional paid-in capital 6,226 6,042 Retained earnings 6,433 6,017 Accumulated other comprehensive loss (868) (805) Total shareholders' investment 11,833 11,297 Total liabilities and shareholders' investment $ 42,779 $ 41,290 Common Stock Authorized 6,000,000,000 shares, $0.0833 par value; 504,198,962 shares issued and outstanding as of February 1, 2020; 517,761,600 shares issued and outstanding as of February 2, 2019. Preferred Stock Authorized 5,000,000 shares, $0.01 par value; no shares were issued or outstanding during any period presented. Consolidated Statements of Comprehensive Income 2019 3,281 $ 2018 2,937 $ 2017 2,914 (millions) Net earnings Other comprehensive (loss)/income, net of tax Pension and other benefit liabilities, net of tax Currency translation adjustment and cash flow hedges, net of tax Other comprehensive (loss)/income Comprehensive income 2 (65) 2 (63) 3,218 $ (52) (6) (58) 2,879 $ 6 8 2,922 Consolidated Statements of Operations 2017 $ 2019 77,130 $ 982 78,112 54,864 16,233 2018 74,433 $ 923 75,356 53,299 15,723 71,786 928 72,714 51,125 15,140 2.225 (millions, except per share data) Sales Other revenue Total revenue Cost of sales Selling, general and administrative expenses Depreciation and amortization (exclusive of depreciation included in cost of sales) Operating income Net interest expense Net other (income) / expense Earnings from continuing operations before income taxes Provision for income taxes Net earnings from continuing operations Discontinued operations, net of tax Net earnings Basic earnings per share Continuing operations Discontinued operations Net earnings per share Diluted earnings per share Continuing operations Discontinued operations Net earnings per share Weighted average common shares outstanding Basic Diluted Antidilutive shares Note: Per share amounts may not foot due to rounding. 2,357 4,658 477 (9) 4,190 921 3,269 12 3,281 $ 2,224 4,110 461 (27) 3,676 746 2,930 7 2,937 $ 4,224 653 (59) 3,630 722 2,908 6 2,914 $ 6.39 $ 0.02 6.42 $ 5.54 $ 0.01 5.55 S 5.32 0.01 5.32 $ 6.34 $ 0.02 6.36 $ 5.50 $ 0.01 5.51 $ 5.29 0.01 5.29 510.9 515.6 528.6 533.2 546.8 550.3 4.1
Step by Step Solution
There are 3 Steps involved in it

Get step-by-step solutions from verified subject matter experts